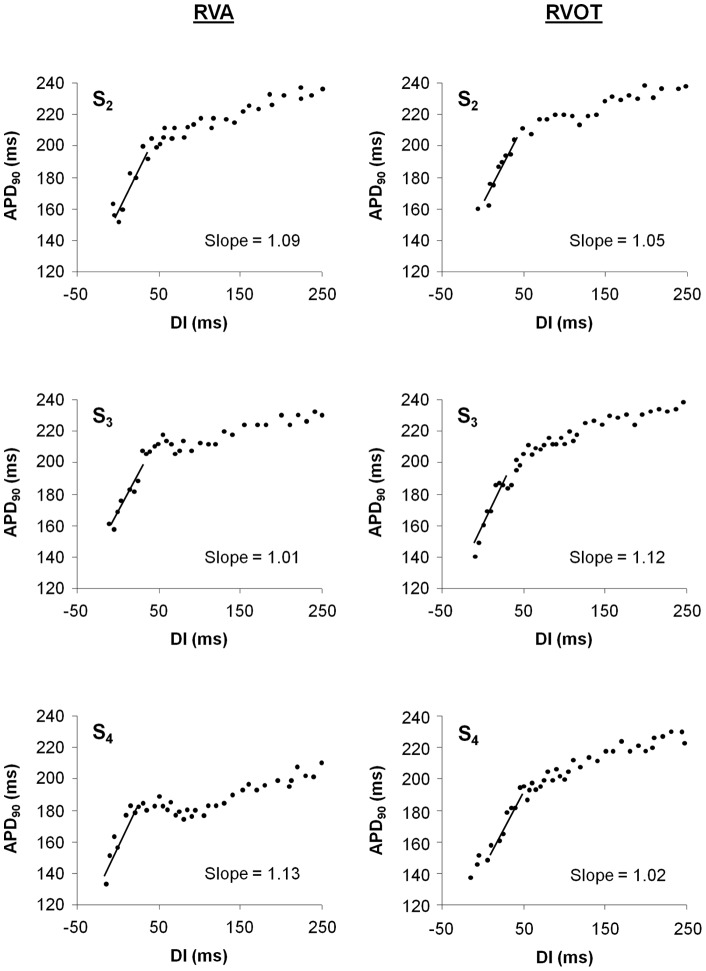
Figure 2. Representative restitution curves.
APD90 restitution curves from one patient with DCM recorded at the right ventricular apex (RVA) and the right ventricular outflow tract (RVOT). For both recording sites, the restitution curves of S2, S3, and S4 are shown. The linear fit to the 40 ms diastolic interval (DI) with the maximum slope is superimposed on the respective curve. The maximum slope value is denoted adjacent to the curve.

