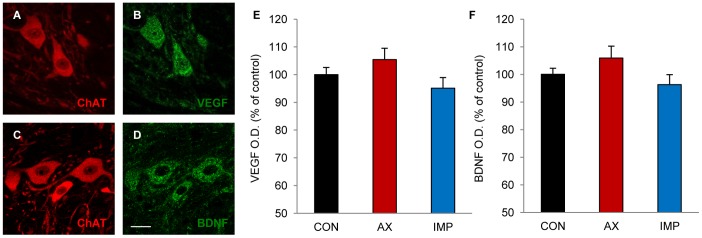
Figure 4. VEGF and BDNF immunoreactivity in abducens motoneurons.

A to D. Confocal microscopy images of control abducens motoneurons showing double immunolabeling for ChAT (A, in red) and VEGF (B, in green), or for ChAT (C, in red) and BDNF (D, in green). Scale bar: 20 µm. E and F. Optical density (O.D.) quantification of VEGF immunoreactivity (E) and BDNF immunoreactivity (F) in abducens motoneurons from either the unlesioned side (CON), the lesioned side of the axotomized group (AX) or the lesioned side of the implanted group (IMP). Values represent percentages with respect to control (motoneurons from the unlesioned side). Bars show the mean ± SEM of 58–79 motoneurons analyzed from three different animals in each group. No significant differences were obtained between groups (ANOVA test followed by Dunn’s method for multiple pairwise comparisons).
