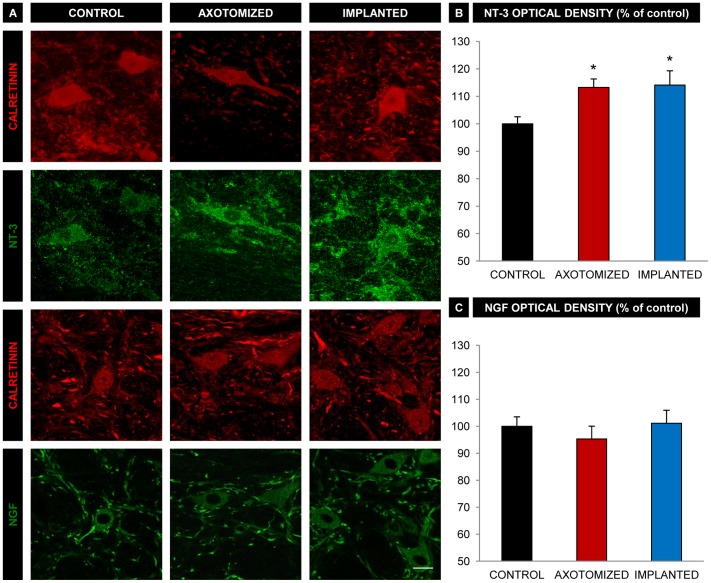
Figure 5. NT-3 and NGF immunoreactivity in abducens interneurons.
A. Confocal images of abducens interneurons (immunopositive for calretinin, in red) showing double immunoreactivity against either NT-3 (in green, second row of images) or NGF (in green, fourth row). Examples of neurons from the different experimental conditions are shown: non lesioned neurons (CONTROL column), lesioned neurons from the axotomized group (AXOTOMIZED column) and lesioned neurons from the implanted group (IMPLANTED column). Scale bar: 20 µm B. Optical density quantification of NT-3 immunoreactivity in unlesioned neurons (CONTROL), lesioned neurons from the axotomized group (AXOTOMIZED) and lesioned neurons from the implanted group (IMPLANTED). Values are expressed as percentages with respect to control (unlesioned neurons). Bars represent the mean ± SEM of 25–38 neurons analyzed from four different animals in each group. *, p<0.05 compared to the control group, no significant differences were obtained between the axotomized and the implanted groups (ANOVA test followed by Dunn’s method for multiple pairwise comparisons, p<0.05). C. Same as B, but for NGF immunoreactivity. Bars represent the mean ± SEM of 26–54 neurons analyzed from three different animals in each group. Note that there were no significant differences between groups (ANOVA test followed by Dunn’s method for multiple pairwise comparisons, p<0.05).

