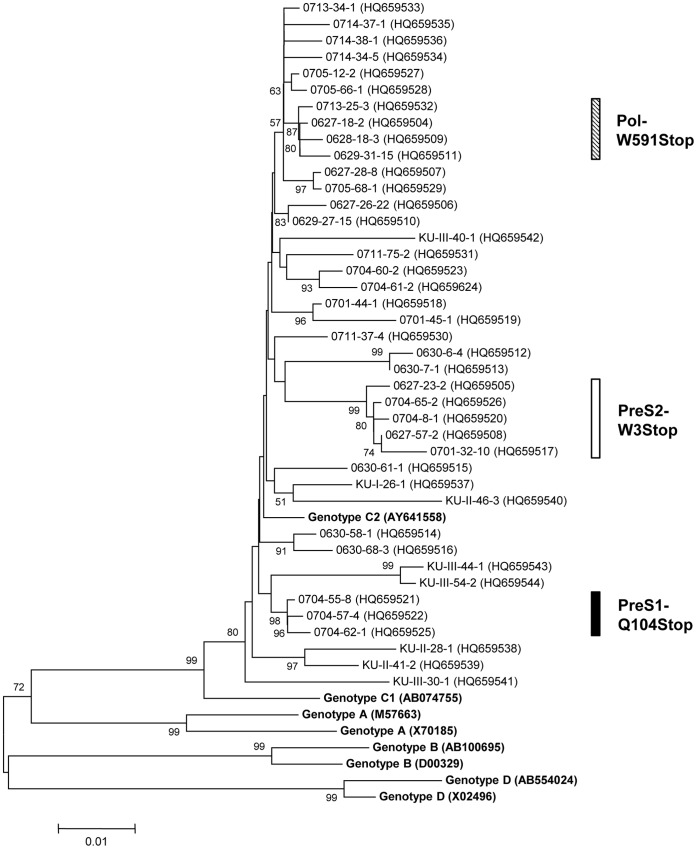
Figure 1. Phylogenetic analysis based on the large surface genome sequences of eight references and 41 HBV occult strains.
Genetic distances were estimated using the Kimura two-parameter matrix and the phylogenetic tree was constructed using the neighbor-joining method. The percentages indicated at the nodes represent bootstrap levels supported by 1,000 re-sampled data sets. Bootstrap values of <50% are not shown. The solid circle indicates that the corresponding nodes (groupings) were also recovered in the maximum-parsimony trees. Numbers in parenthesis are Genbank numbers.

