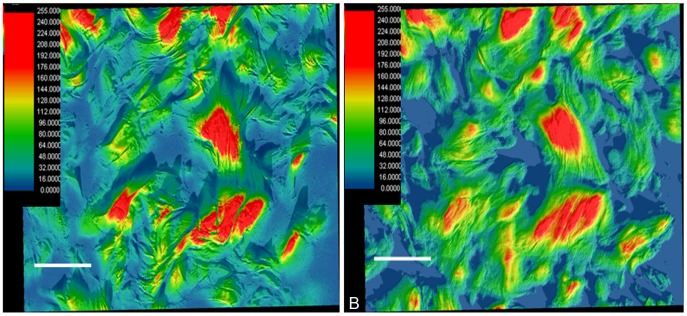
Figure 6. Surface plots of birefringent images of skin CBs.
In A and B, false colors were correlated with the birefringence brilliance images shown in Figures 5A and 5F, respectively. The differences in image focal planes due to the paths followed by the CBs from one focal plane to the subsequent deeper one in the same section are represented by different colors. The scale inserted on the left in A and B corresponds with pixel values that are representative of the various false colors. Bar = 50 µm.

