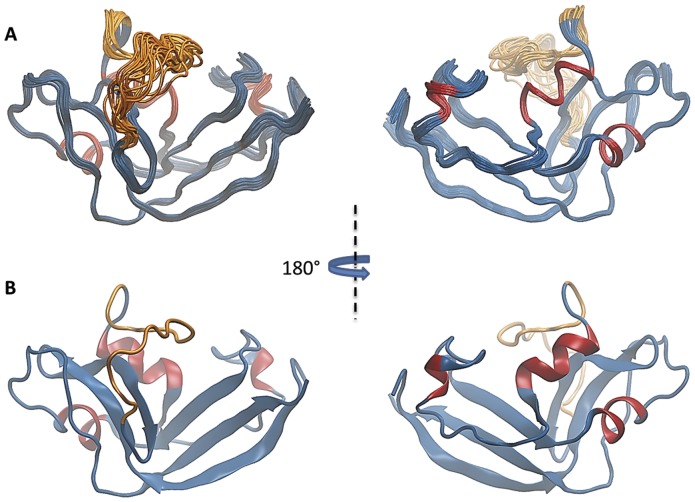
Figure 3. 3D structure of ONCFLG by NMR.
(A) Backbone superposition of the 20 lowest energy conformers of ONCFLG. The disordered linker segment (Gly33-Gly48) is represented in orange and the rest of the protein backbone sequence in blue except for the α-helices which are in red. The views are rotated 180° with respect to each other. (B) Ribbon drawing of a representative conformer of the energy-minimized family of ONCFLG variant structures. Colors and the orientation are the same as in (A). This figure was generated by VMD [41].

