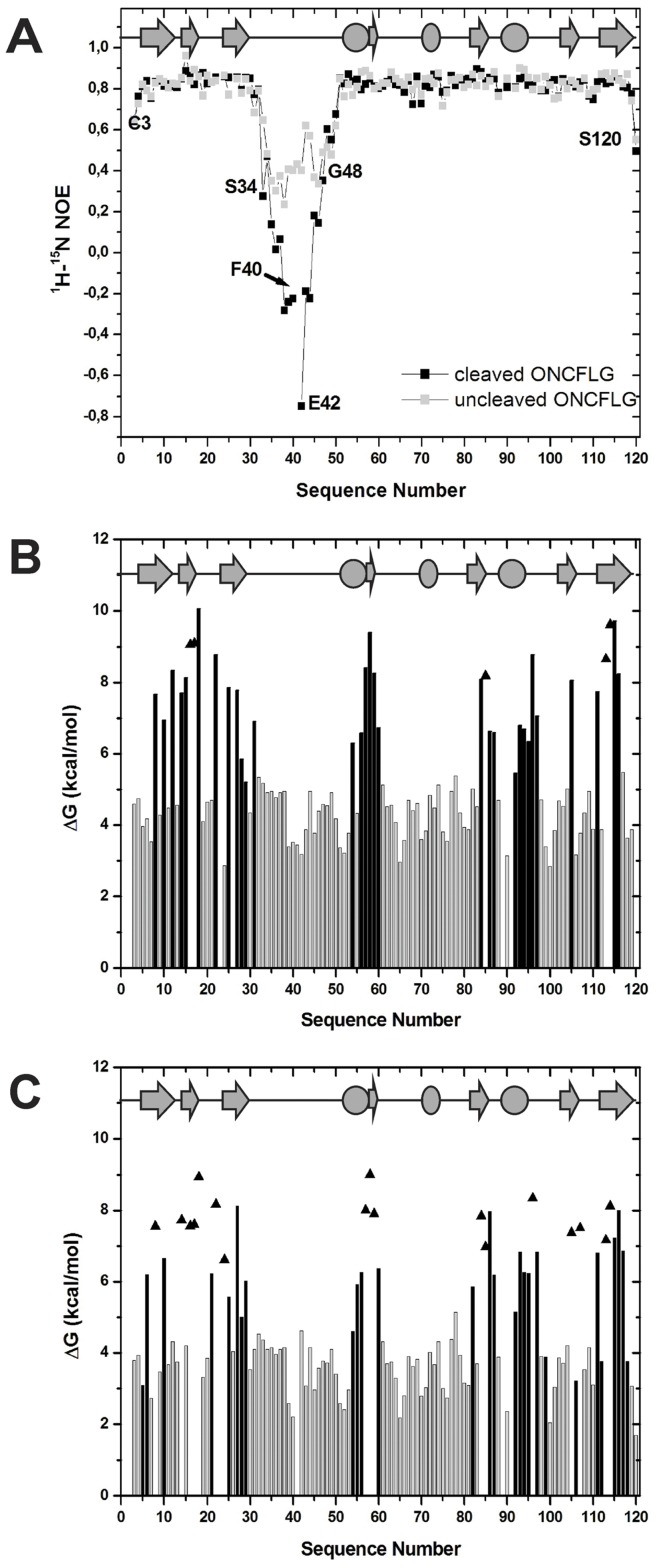
Figure 6. Dynamics and conformational stability of the ONCFLG variant forms.
(A) The 1H-15N NOE ratio for the uncleaved (gray) and cleaved ONCFLG forms (black) as a function of the sequence number. Lines connecting gray or black squares boxes are used to guide the eye. (B) and (C) ΔGHX values obtained by NMR-monitored 1H-2H exchange of the uncleaved (B) and cleaved (C) forms of the ONCFLG as a function of the sequence number. Grey bars represent the upper limits for fast exchanging groups, black bars show experimentally measured values and triangles indicate the estimated lower limit for slow exchanging groups. The secondary structure is represented on the top of each panel, β-strands as gray arrows and α-helices as ovals.

