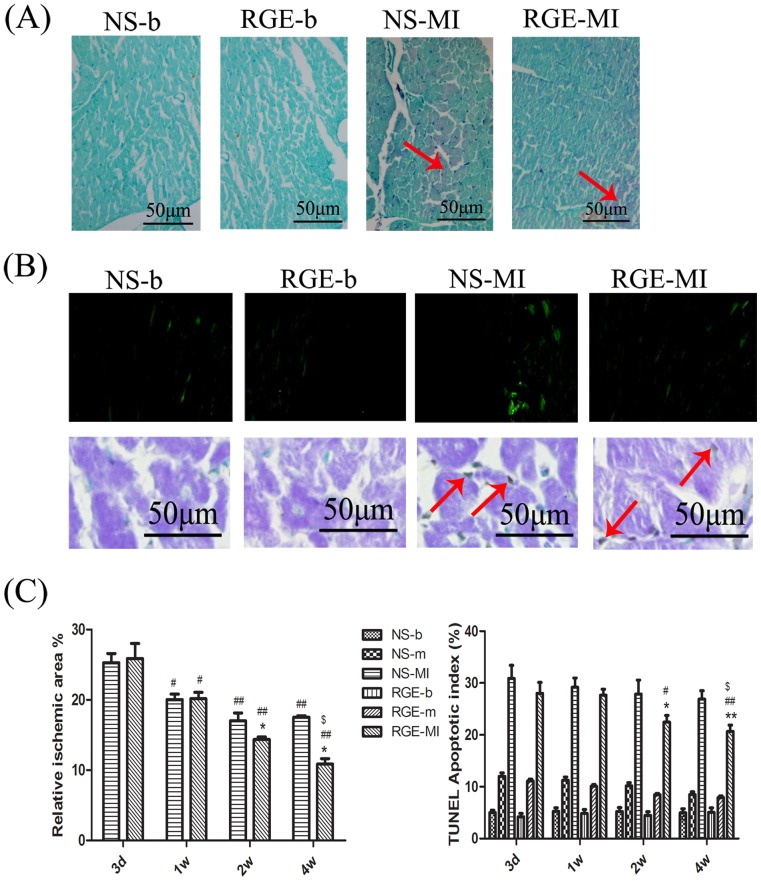
Figure 2. Poley’s stain and TUNEL stain of ischemic myocardium.
(A) Poley’s stain of NS-b, RGE-b, NS-MI, RGE-MI groups at week 4. The ischemic areas were stained red indicated by red arrow and non-ischemic area were stained blue. (B) TUNEL stain of NS-b, RGE-b, NS-MI, RGE-MI groups at week 4. The apoptotic myocardial cells were green under fluorescent and brown under Immunohistochemistry stain indicated by red arrow. (C) Quantitative analysis of mean relative ischemic area (percentage of the total transverse sections area) and myocardium apoptotic index (ratio to total myocardial cells). Data are mean ± SD. *P<0.05, **P<0.01 vs. NS group at the same time, #P<0.05, ##P<0.01 vs. the same group at day 3, $P<0.05, vs. the same group at week 1.

