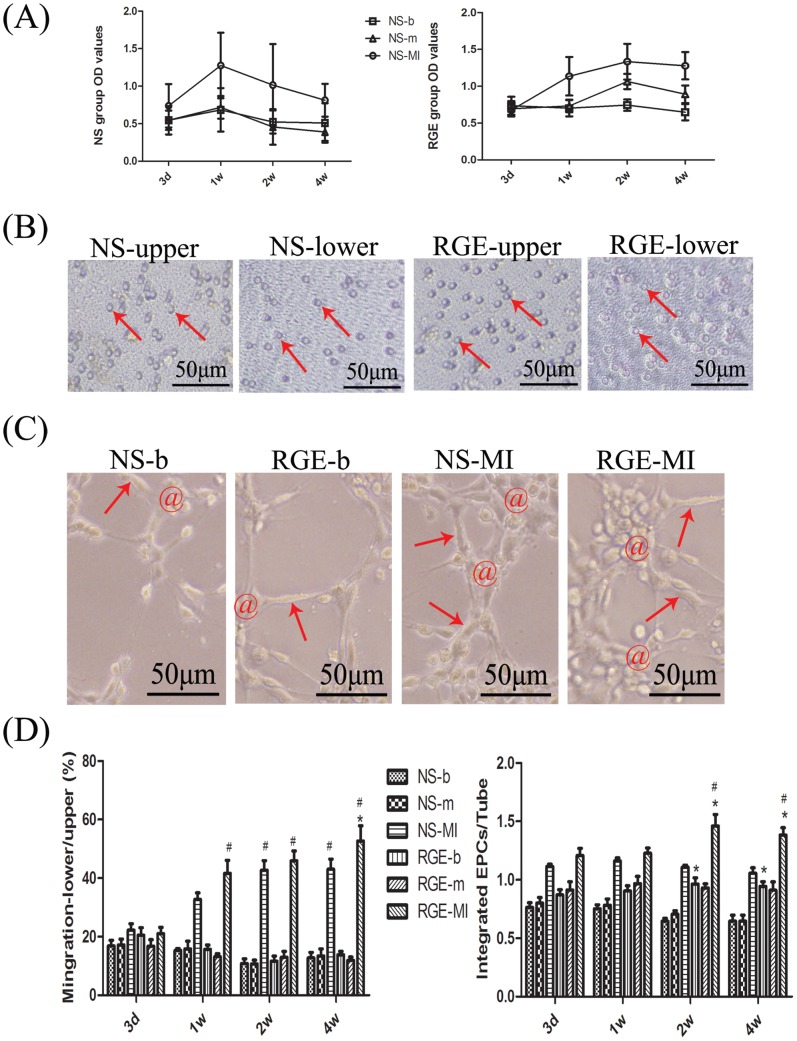
Figure 4. Effect of RGE on EPC function.
(A) MTT assay of proliferation of EPCs. (B) Transwell-chamber migration assay of EPCs at week 4. The activated EPC (marked by red arrow) migrated from upper chamber to the lower chamber. (C) Assessment of angiogenesis with EPCs placed on Martrigel and forming tubular-like structures at week 2. EPCs integrated in tubular-like structures are marked by red @; the formed tube was marked by red arrow. (D) Quantification of migration and angiogenesis of EPCs. For migration, data are percentage of EPCs migrating to the lower chamber as compared with those in the upper chamber. For angiogenesis, data are the ratio of EPCs integrated in tubular-like structures and the tubes involved. Each test was repeated 4 times, and data are mean ± SD. *P<0.05 vs. NS group at the same time, #P<0.05 vs. the same group at day 3.

