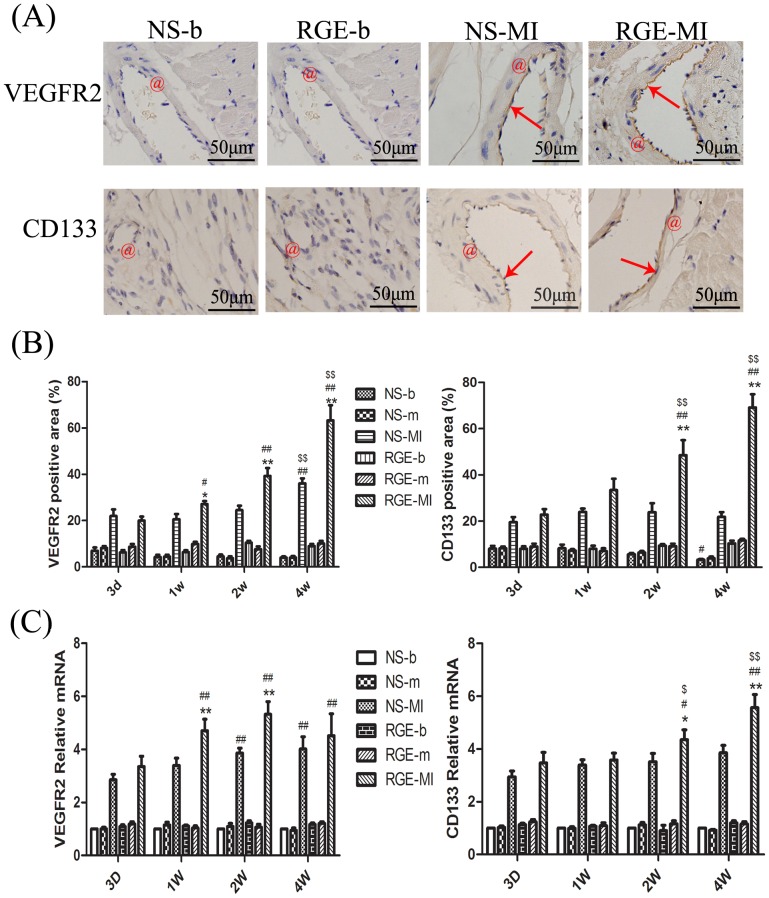
Figure 5. Effect of RGE on angiogenesis at the MI area.
(A) Immunohistochemistry of VEGFR2 and CD133 in NS-b, NS-MI, RGE-b and RGE-MI groups at week 4. The vessels are indicated by red @, and positive colorations are indicated by red arrows. (B) Quantification of VEGFR2 and CD133 immunoreactivity (percentage of positive area) in each group. (C) Quantitative PCR analysis of VEGFR2 and CD133 in myocardial tissue. For real-time PCR, the NS-b group was considered the baseline, actin was the internal reference. Data are mean ± SD. *P<0.05, **P<0.01 vs. NS group at the same time, #P<0.05, ##P<0.01 vs. the same group at day 3, $P<0.05, $$P<0.01 vs. the same group at week 1.

