
Figure 1. Two-dimensional schematic of the DNA conformation.
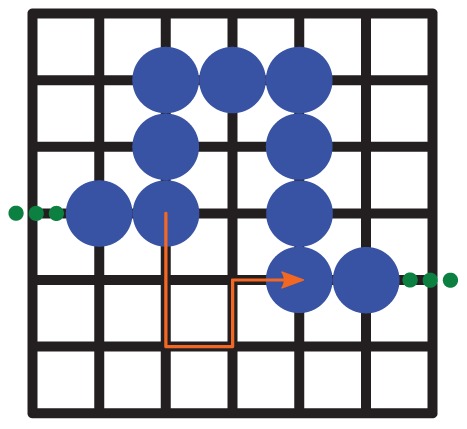
The circles denote single DNA blobs. The lattice spacing is twice the blob radius:  . A part of an exemplary search trajectory is depicted by the arrow.
Official websites use .gov
A
.gov website belongs to an official
government organization in the United States.
Secure .gov websites use HTTPS
A lock (
) or https:// means you've safely
connected to the .gov website. Share sensitive
information only on official, secure websites.
The circles denote single DNA blobs. The lattice spacing is twice the blob radius: . A part of an exemplary search trajectory is depicted by the arrow.