
Figure 7. Mean search time and minimal search time.
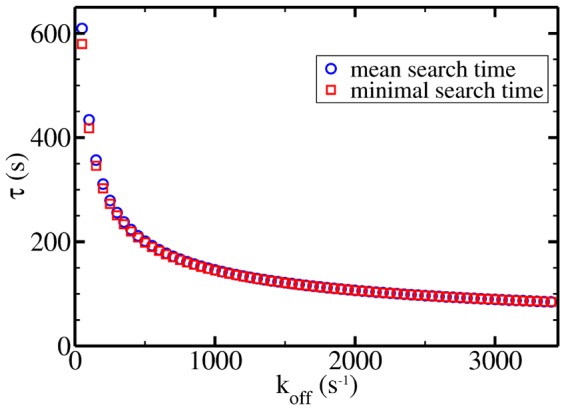
The mean search time and the minimal search time (with appropriately chosen  ) are plotted as a function of the dissociation rate at parameters relevant for the interior of living cells.
Official websites use .gov
A
.gov website belongs to an official
government organization in the United States.
Secure .gov websites use HTTPS
A lock (
) or https:// means you've safely
connected to the .gov website. Share sensitive
information only on official, secure websites.
The mean search time and the minimal search time (with appropriately chosen ) are plotted as a function of the dissociation rate at parameters relevant for the interior of living cells.