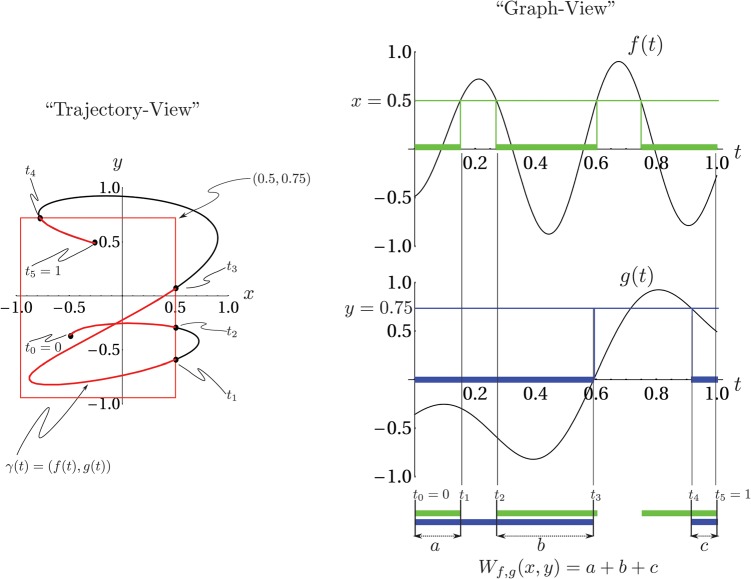
Figure 1.
(Color online) Left panel: A plot of the curve used to visualize the joint cumulative density function, , of values of the functions and . The probability density is non-zero only on the curve because the random variables , are concentrated exclusively on . On the right is an graphical calculation of using the graphs of and . The exact definition of is given in Eq.B1.

