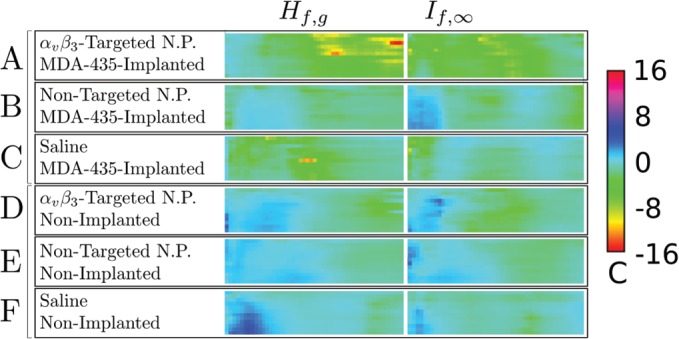
Figure 7.

Confidence, c, panels for (left column) and (right column) for all groups used in our study. (A) MDA 435-implanted mice injected with -targeted nanoparticles (), (B) MDA 435-implanted mice injected with non-targeted nanoparticles (), (C) MDA 435-implanted mice injected with saline (), (D)–(F), same injections into tumor-free mice. The smoothing spline parameter in all cases. A color-to-confidence calibration bar is shown to the right of the confidence panels.
