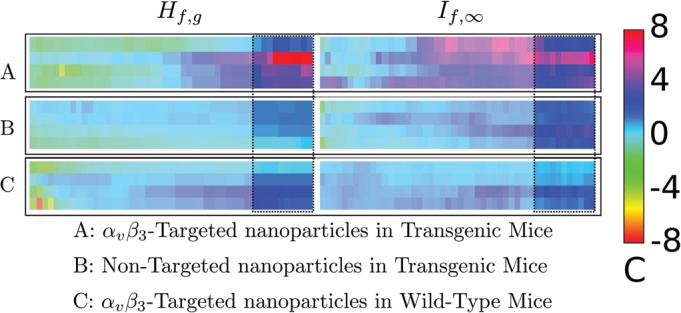
Figure 8.

Comparison (left) and (right) for data acquired in a pre-cancer model (Ref. 7) like that shown in Fig. 7. While analysis at all thresholds between 0% and 100% was undertaken, we wish to focus attention on the results obtained between 75% and 100% (results from lower analysis thresholds have been “dimmed” by a translucent overlay). In both cases, a broad region of confidence values above 2 is shown. While the extent of this region is larger in the confidence panel, the maximum height of the confidence panel is more than twice as high (16.0 vs 6.8). A color-to-confidence calibration bar is shown to the right of the confidence panels.
