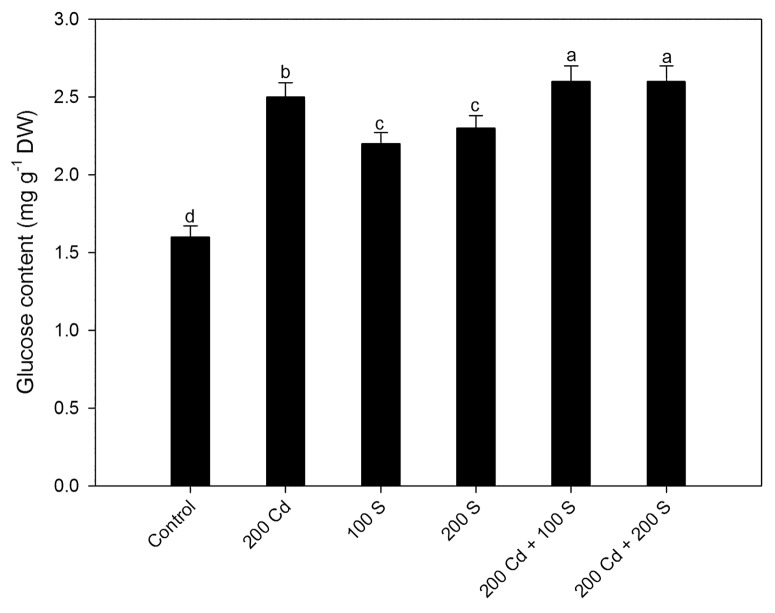
Figure 1. Leaf glucose content in mustard after treatment with Cd and/or S treatments at 30 d after sowing. Plants were grown with 0, 200 mg Cd kg−1 soil (200 Cd), 100 mg S kg−1 soil (200 S) or 200 mg S kg-1 soil (200 S) with combined Cd and S treatments. Means values ± SE are shown (n = 4). Means denoted by the same letter are not significantly different at p < 0.05 according to least significant difference test. Cd, cadmium; DW, dry weight; S, sulfur.

An official website of the United States government
Here's how you know
Official websites use .gov
A
.gov website belongs to an official
government organization in the United States.
Secure .gov websites use HTTPS
A lock (
) or https:// means you've safely
connected to the .gov website. Share sensitive
information only on official, secure websites.
