
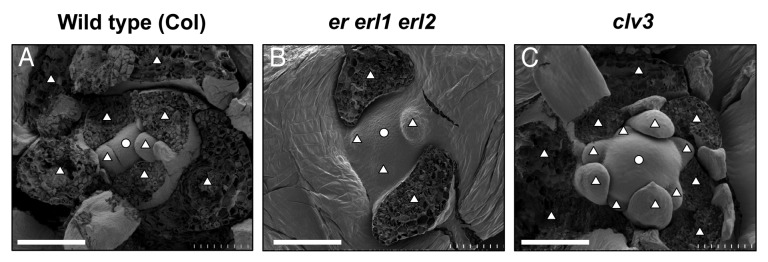
Figure 1. SEM images of shoot apex regions. The SAMs of 10-d-old seedlings with the genotypes of (A) wild type (Col), (B) er-105 erl1–2 erl2–1 triple mutant and (C) clv3–2 mutant were observed by SEM. Circles indicate the SAMs. Triangles indicate leaf primordia and traces of developing leaves that were removed to observe the SAM. Bars = 100 µm