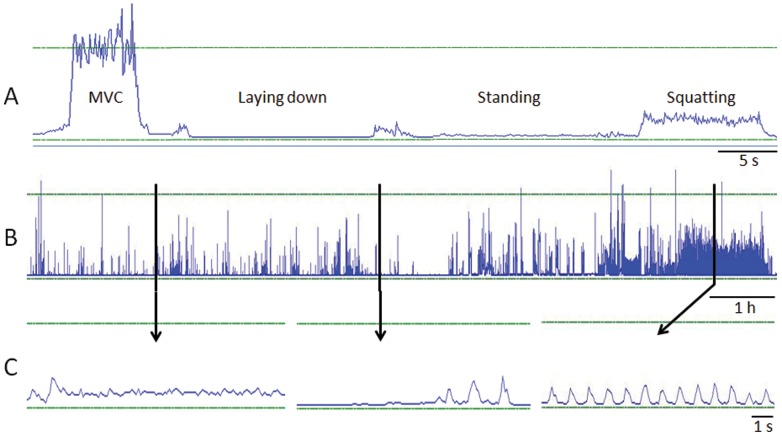
Figure 2. Example EMG data from laboratory and field measurements.
Examples of averaged EMG data of left quadriceps femoris from one subject. Part A shows from the laboratory measurement session MVC of knee extension, lying down, standing still and squatting. Part B shows EMG activity during the entire day. Part C shows zoomed areas from daily EMG data (thick vertical lines show which parts of the data are zoomed). Horizontal lines represent baseline and 100% of EMGMVC.

