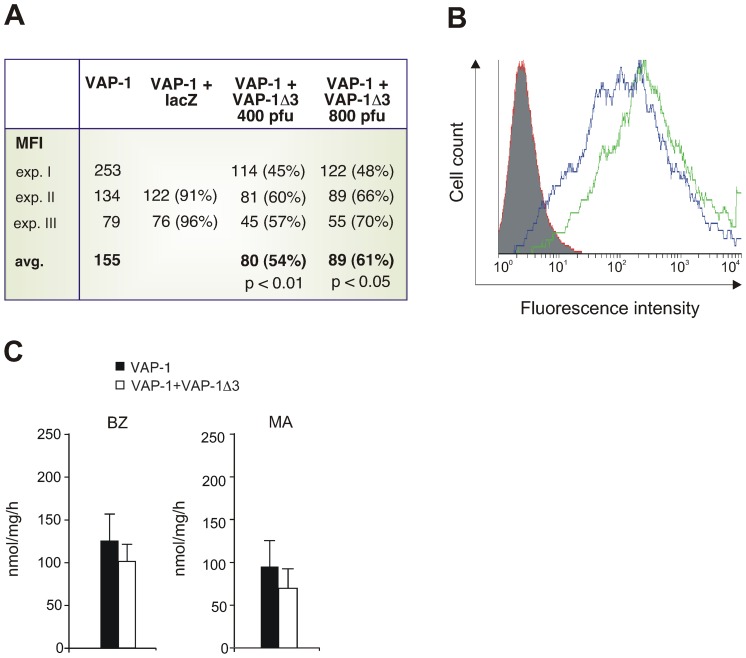
Figure 5. VAP-1 cell-surface expression and SSAO activity of transfectants expressing both VAP-1 and VAP-1 Δ3.
HUVECs were first infected with adenoviruses carrying the cDNA for the full-length VAP-1 and then with those carrying the VAP-1Δ3-cDNA. LacZ adenoviruses were used as co-transfection controls. VAP-1 expression was determined by FACS using the antibody JG 2.10. (A) The surface expression of VAP-1 in the transfected cells as mean fluorescence intensities (MFIs) and the averages of MFIs from three experiments. In parentheses, the percentage of VAP-1 surface expression in the co-transfected cells compared to the cells transfected only with VAP-1 ( = 100%). VAP-1Δ3 adenoinfection was performed with two different doses, 400 and 800 pfu (B) A histogram of a representative experiment. The number of cells is shown in the y-axis and the fluorescence in the x-axis. The green histogram shows VAP-1 surface expression in the cells co-infected with the control lacZ adenovirus, the blue histogram shows VAP-1 expression in the cells co-infected with VAP-1Δ3, and the red histogram shows the staining with a negative control antibody. (C) SSAO activity of stably transfected VAP-1-CHO cells co-transfected either with the EGFP-IRES2 empty vector (black) or with the same vector carrying VAP-1Δ3 (white). The enzymatic activity of lysed transfectants was determined in fluorometric assays. The substrates used were BZ benzylamine; MA methylamine (1 mM). Results are shown as nmol of H2O2/mg/h+SEM. The experiment was repeated four times with MA and five times with BZ.

