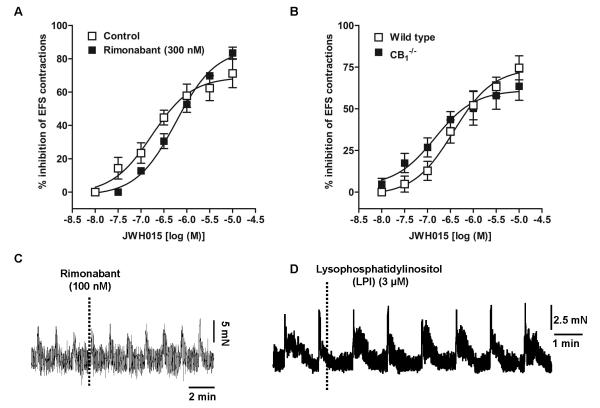
Figure 5. Concentration –dependent response curves of JWH015, a CB2/GPR55 agonist, on neurogenic contraction inhibition in mouse ileum.
A) control (open squares) vs in the presence of rimonabant (300 nM), a CB1 receptor antagonist (filled squares) in ileum strips from wild type mice and B) comparison between wild type (open squares) and CB1−/− (filled squares). The concentration –response curves were subjected to non – linear regression for calculation of pD2 values. Each data point represents mean ± SE, analyzed by two-way ANOVA followed by Bonferroni’s posttest, n=3-4. Bottom panel displays representative tracing showing lack of effect of rimonabant (100 nM) (C) or lysophosphatidylinositol (3 μM) (D), considered to be an endogenous ligand for GPR55 receptors, on neurogenic contractions of wild –type mouse ileum.

