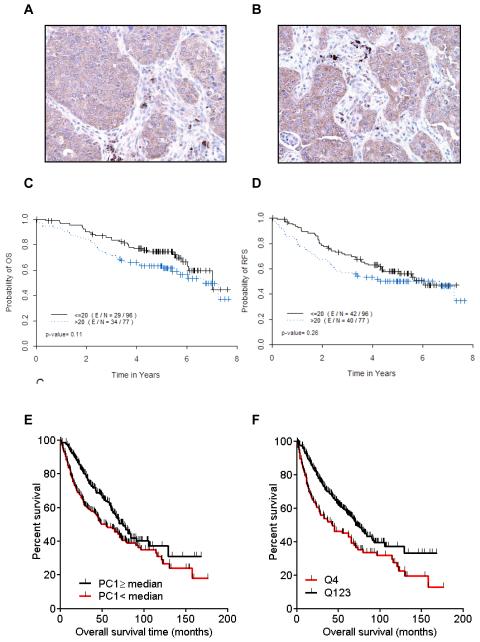
Figure 3. Expression of CXCR2 and its ligands in tumor cells and tissues.
CXCR2 axis and CXCL5 expression are associated with poor outcome. Immunohistochemical expression of CXCR2 in two NSCLC tissue specimens, (A) squamous cell carcinoma and (B) adenocarcinoma. Kaplan-Meier curves for (C) overall survival and (D) recurrence-free survival as a function of cytoplasmic CXCR2 expression in 173 patients who underwent resection for lung adenocarcinoma. (E) First principal component (PC1) was computed with expression of the CXCR2 genes and its ligand genes (CXCL6, IL8, CXCL2, CXCL1, CXCL3, CXCL7, and CXCL5); Kaplan-Meier curves for overall survival among patients with high versus low PC1 based on the median. (F) Kaplan-Meier curves for overall survival for patients with high (highest quartile) versus low (lowest quartile) CXCL5 gene expression.

