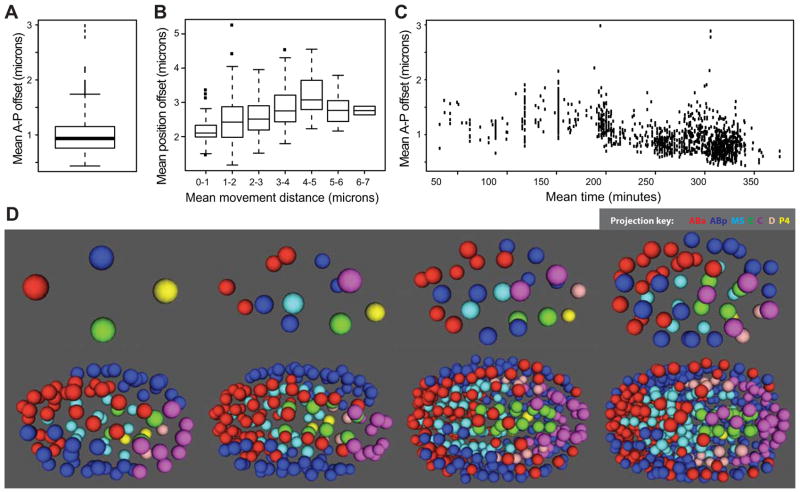
Figure 5. Quantification and variability of nuclear position.
A) Deviations from average position. Each cell’s mean nuclear A–P axis offset from the canonical position (mean of all embryos) was calculated and the boxplot shows the average of these mean offsets across all embryos. B) Position variability (A–P offset as in (B)) increases for cells that move larger distances (x axis). C) Nuclei adopt more reproducible positions in late embryos than early embryos. D) 3D-projection models of the reference embryo at different stages of development. The full model, with a graphical user interface, is available as a Supplemental Data File.

