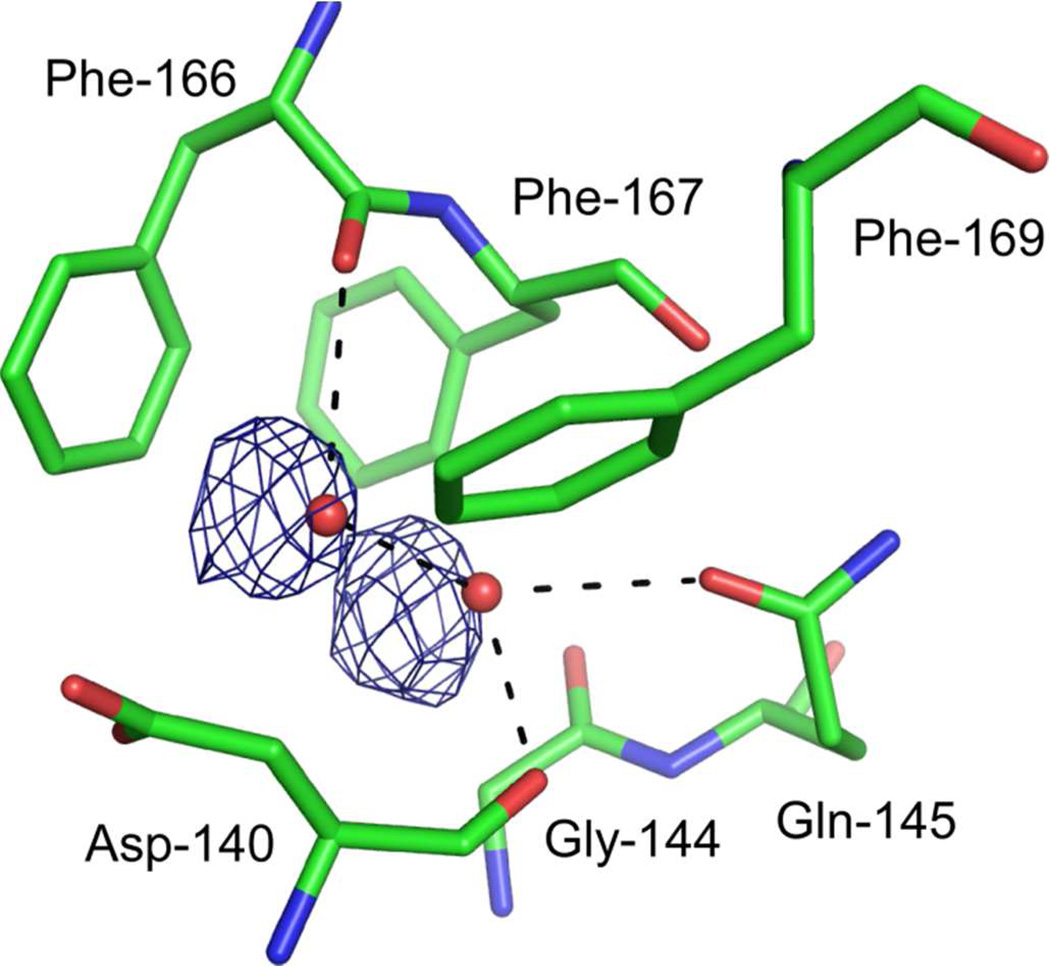
Figure 7.
CO migration at site-3. Weighted difference Fourier map between the dark and light states with illumination for 16 hr, contoured at ±4.0 σ, superimposed on the model of the CO-bound form. Residues located within 4.0 Å from two water molecules are shown as sticks. Hydrogen bonds with two water molecules are shown as dashed lines.

