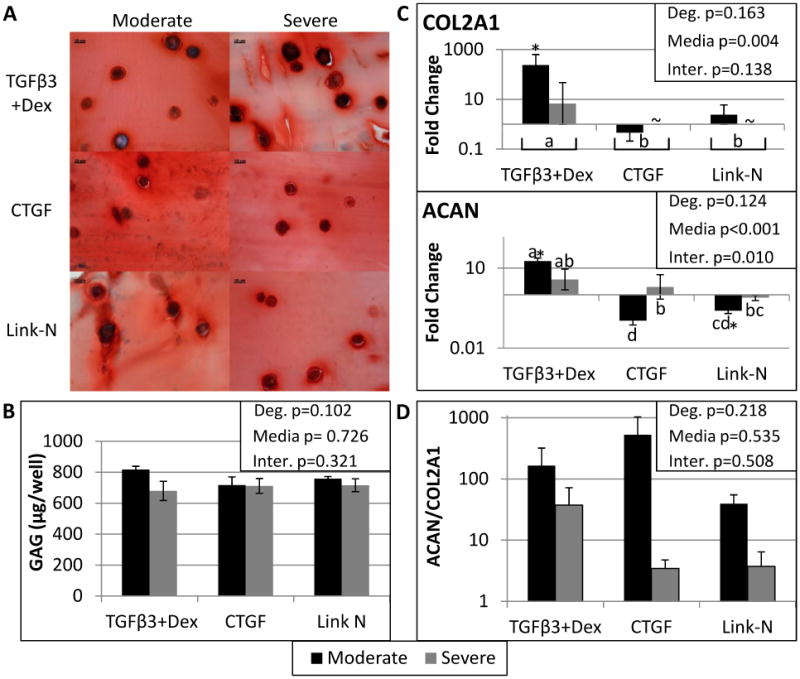
Figure 2. All groups created a GAG rich matrix, however an increase in ACAN and COL2A1 and high ACAN/COL2A1 ratios were only demonstrated in moderately degenerated cells.

Histology of 10 micron frozen slices through the alginate bead constructs stained with Safranin O at 60X, where the scale bar is 10 microns (A). DMMB analysis was used to quantify the amount of GAG produced by the human degenerated NP cells (B). There were no significant differences in GAG production between media groups or with degree of degeneration. qRT-PCR results for Aggrecan (ACAN) and Collagen type II alpha 1 (COL2A1) (C) are also shown, with ACAN and COL2A1 only significantly upregulated in moderately degenerated cells stimulated with TGFβ3+Dex. Finally, the ratio of relative gene expression was calculated with the formula: 2−(ΔCt ACAN−ΔCt COL2A1). A CT value of 40 was substituted for COL2A1 for the severely degenerated samples treated with Link-N and CTGF since there was nothing detected after 35 cycles of qRT-PCR. A two way ANOVA was performed with degeneration and media condition as factors, with the results shown in the upper right corner for all assays. Treatment groups with different letters are significantly different (Fisher's post hoc test α=0.05 was run for each media condition with pooled degenerative grades or when there was a significant interaction between media and degeneration a post hoc test was run with all six groups). ∼ indicates the gene was not expressed by that group. Student's t-test indicated significant differences from day 0 represented by a *. Significance was always defined as p<0.05. Error bars represent SEM.
