Figure 6.
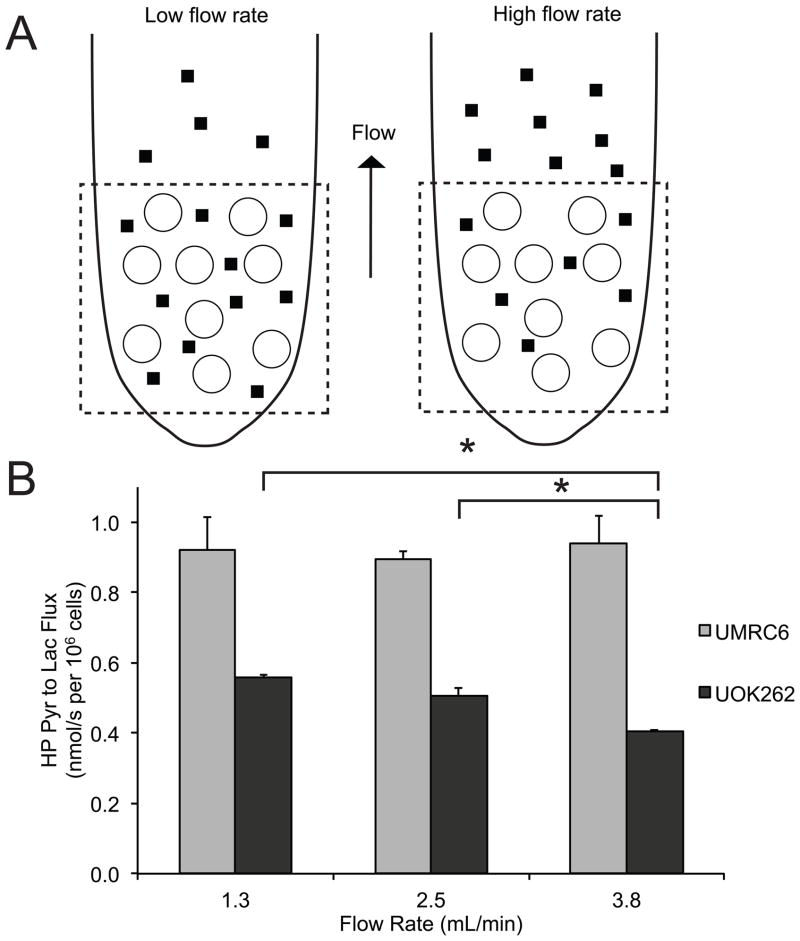
Dynamic HP pyruvate-to-lactate flux in the RCC cells following flow rate modulation in the bioreactor. (A) Schematic illustrating the relationship between flow rates and observed HP pyruvate-to-lactate flux in the bioreactor. At high flow rates, the extracellular lactate will more likely to flow out of the NMR coil’s sensitive volume and will not contribute to the MR signal, thereby decreasing the observed pyruvate-to-lactate flux. The dotted square represents NMR sensitive region. ○ denotes encapsulated microspheres containing cells. ▮ denotes extracellular lactate. (B) HP pyruvate-to-lactate flux of UOK262 and UMRC6 cells at 3 different flow rate (N=5 each). There is a decreasing trend in observed pyruvate-to-lactate flux with increasing flow rate for UOK262 cells. All values are reported as mean ± std. err. * denotes significance (p<0.05).

