
Figure 3. Differential p73 induction by cryptochrome in p53 null background.
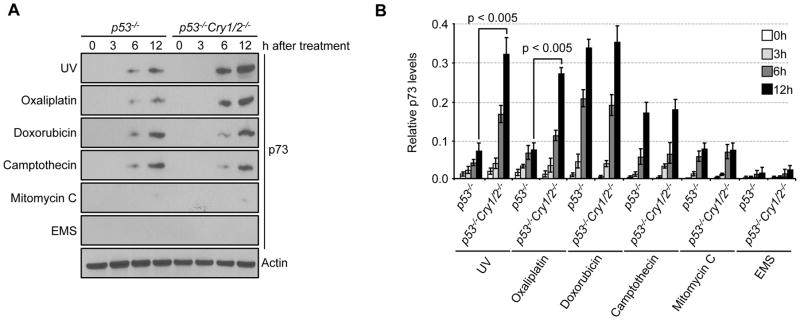
(A) Cells were irradiated with or exposed to 5 Jm−2 UV, 10 μM oxaliplatin, 5 μM doxorubicin, 1 μM camptothecin, 2.5 μM mitomycin C, or 2.5 mM EMS for the indicated times, after which, cell lysates were analyzed by immunoblotting for p73. (B) Results of p73 quantification are normalized to the expression of actin and shown. Actin for EMS-treated cells was shown as a representative image. Error bars indicate one standard deviation from the mean (n=3).