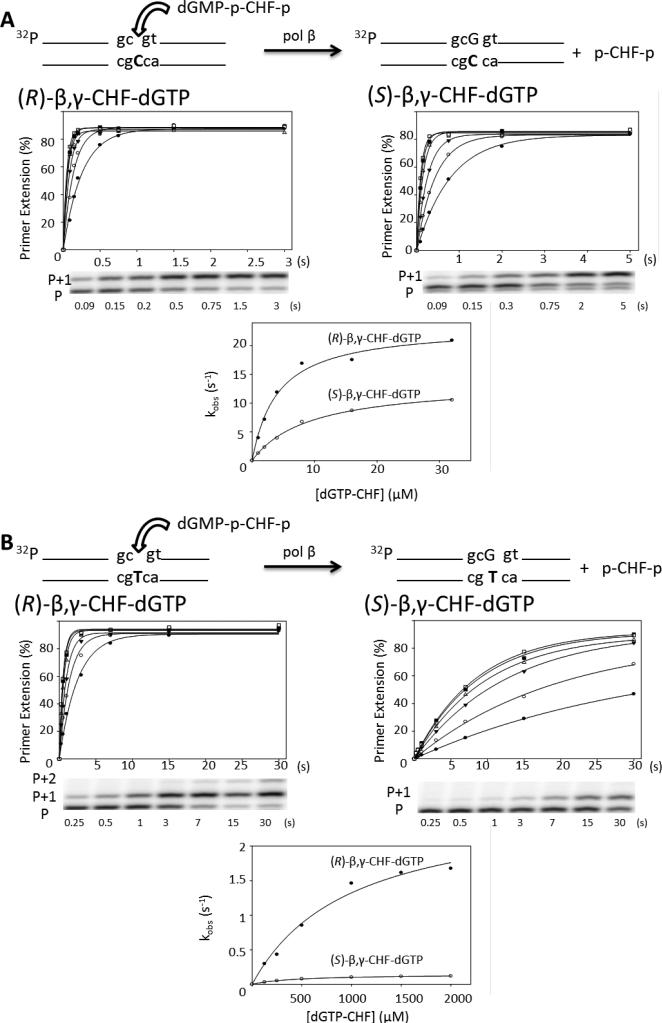
Figure 2.
Presteady state incorporation into single-gap DNA substrate reactions with separate CHF diastereomers. (A) Correct incorporation opposite dC of R (left) and S (right) diastereomers. The plot of percentage primer extension vs. time is shown for all six concentrations of analogue (1 μM, filled circles; 2 μM, open circles; 4 μM, filled triangles; 8 μM, open triangles; 16 μM, filled squares; 32 μM, open squares), below which is a representative gel showing a time course with 1 μM analogue. The corresponding reaction time is shown below each lane. P represents the unextended primer, and P+1 the extension by a single dGMP. The observed rate constant is plotted opposite the corresponding analogue concentration for both the R and S analogues on the same plot for comparison purposes. (B) Misincorporation opposite dT of R (left) and S (right) diastereomers. The plot of percentage primer extension vs. time is shown for all six concentrations of analogue (125 μM, filled circles; 250 μM, open circles; 500 μM, filled triangles; 1000 μM, open triangles; 1500 μM, filled squares; 2000 μM, open squares), below which is a representative gel showing a time course with 125 μM analogue. P represents the unextended primer, P+1 the extension by a single dGMP, and P+2 a second incorporation by displacement of the downstream oligonucleotide, which is only observed for the R diastereomer. The corresponding reaction time is shown below each lane. The observed rate constant is plotted opposite the corresponding analogue concentration for both the R and S analogues on the same plot for comparison purposes. The reactions were carried out in triplicate and have an SEM of ± 15%; the figure shows a representative data set.

