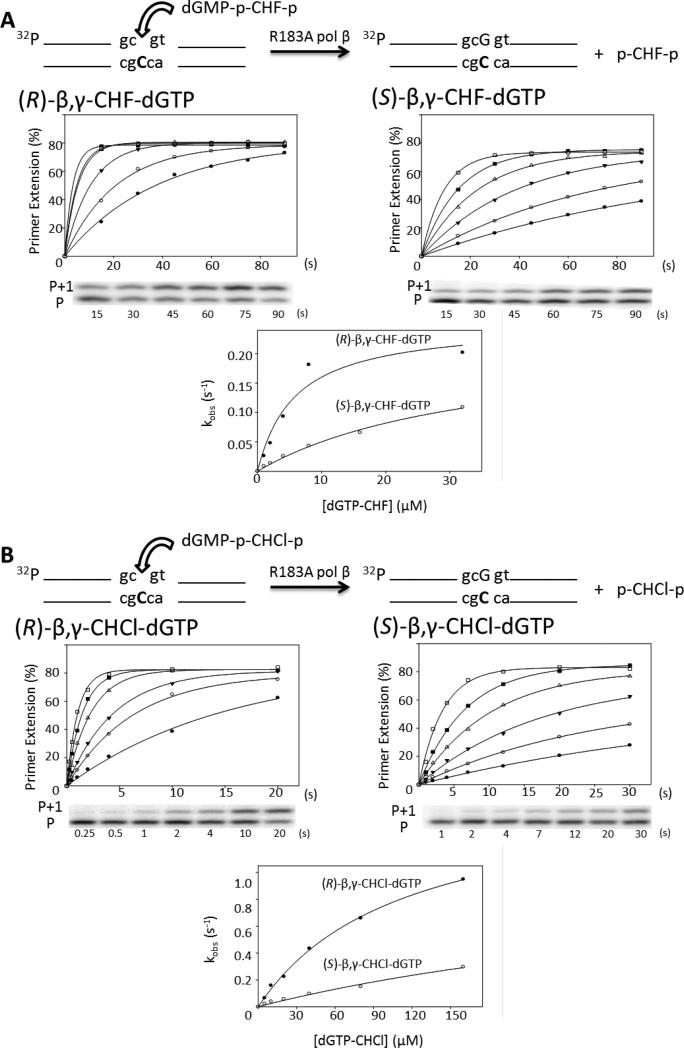
Figure 5.
Presteady state incorporation by R183A pol β into single-gap DNA substrate reactions with separate diastereomers. (A) Correct incorporation opposite dC of (R)-β,γ-CHF-dGTP (left) and (S)-β,γ-CHF-dGTP (right) diastereomers. The plot of percentage primer extension vs. time is shown for all six concentrations of analogue (1 μM, filled circles; 2 μM, open circles; 4 μM, filled triangles; 8 μM, open triangles; 16 μM, filled squares; 32 μM, open squares), below which is a representative gel showing a time course with 1 μM analogue. P represents the unextended primer, and P+1 the extension by a single dGMP. The corresponding reaction time is shown below each lane. The observed rate constant is plotted opposite the corresponding analogue concentration for both the R and S analogues on the same plot for comparison purposes. (B) Correct incorporation opposite dC of (R)-β,γ-CHCl-dGTP (left) and (S)-β,γ-CHCl-dGTP (right) by R183A pol β. The plot of percentage primer extension vs. time is shown for each concentration of analogue (5 μM, filled circles; 10 μM, open circles; 20 μM, filled triangles; 40 μM, open triangles; 80 μM, filled squares; 160 μM, open squares) with a representative gel picture underneath; the corresponding reaction time is shown below each lane. The observed rate constant is plotted vs. the corresponding analogue concentration below. The reactions were carried out in triplicate and have an SEM of ± 15%; the figure shows a representative data set.

