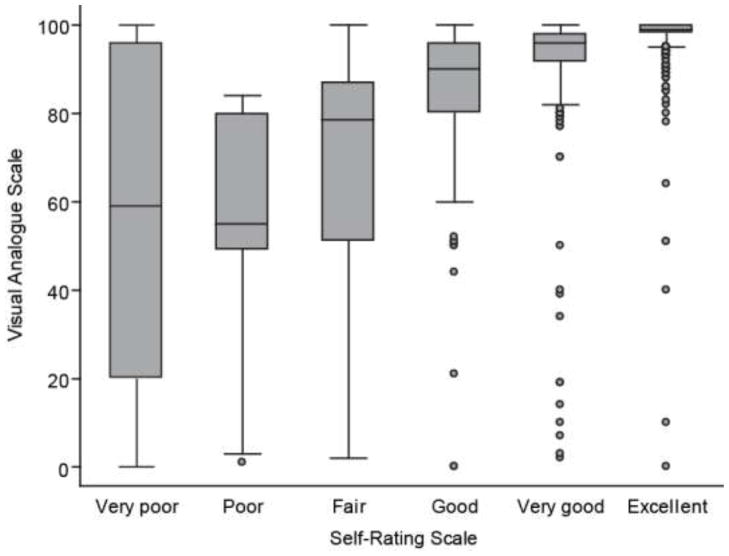
Figure 1.
Box and whiskers plot of the distribution of visual analogue scale (VAS) results at each level of the Self-Rating Scale Item (SRSI). The gray box shows the inter-quartile range of the VAS, and the horizontal line in the middle shows the median value. The whiskers show 1½ times the inter-quartile range, and individual observations more extreme than those values are shown as dots.

