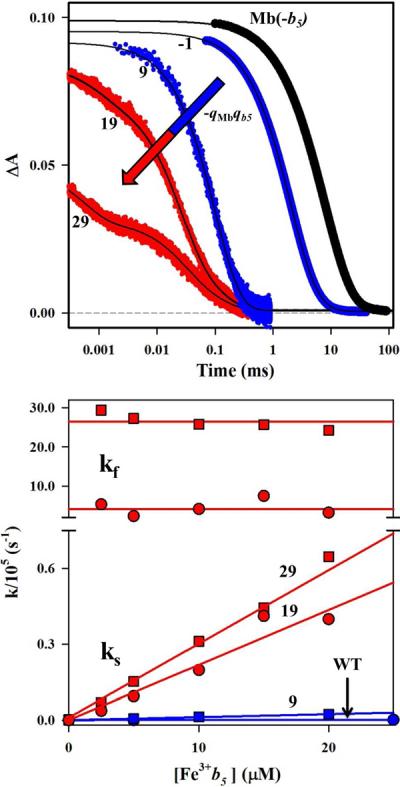
Figure 3.

Triplet decay traces at [b5]/[Mb] = 2 (upper) and fit parameters during titrations of Mb with b5 (lower). Data for the Mb(wt) (circles) and Mb(+2) (squares) complexes, classified as FE (blue), were analyzed with a single exponential decay function; the Mb(+4) (circles) and Mb(+6) (squares) complexes, classified as SE (red), were analyzed with a bi-exponential decay function. Conditions: 5 μM Mb; 5 mM KPi, pH 6, 20°C, 475 nm.
