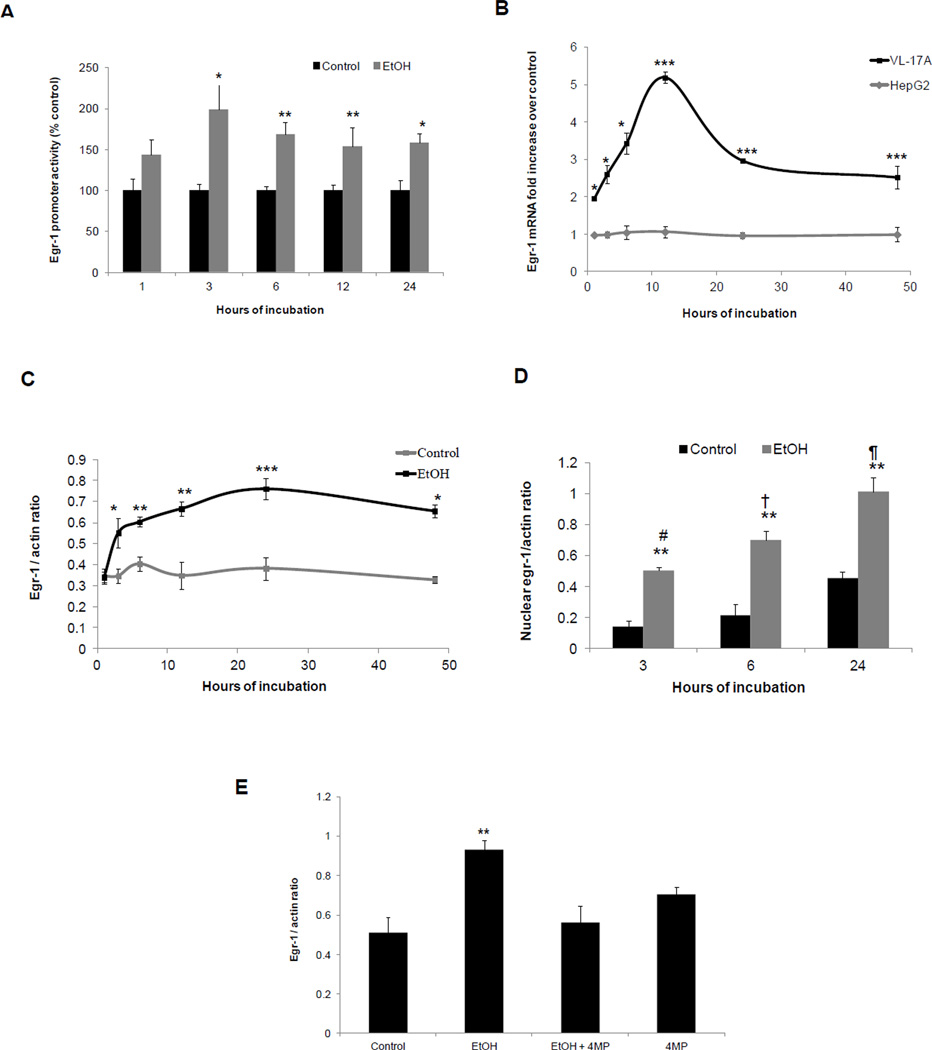
Fig 1. Effects of ethanol on Egr-1 content in VL-17A cells.
(A) Egr-1 promoter activity performed in VL-17A cells exposed to zero (controls) or 50mM ethanol for various time periods as indicated in the figure. (B) Egr-1 mRNA levels in HepG2 and VL-17A cells exposed to zero (controls) or 50 mM ethanol for the indicated time periods. At each time point the control value (i.e. cells treated without ethanol) is 1 for both cell-types and is not shown (C) Densitometric ratios of Egr-1 to β-actin in VL-17A cells exposed to zero (controls) or 50 mM ethanol for various time points as indicated in the figure. (D) Densitometric ratios of nuclear Egr-1 to β-actin in VL-17A cells exposed to zero (controls) or 50mM ethanol for the indicated times. (E) Densitometric ratios of Egr-1 to β-actin in VL-17A cells treated with ethanol in the presence and absence of 4- MP. Data are mean values ± SEM of 4 to 8 samples. ****P < 0.0001, ***P < 0.001,**P < 0.01, *P< 0.05 (control vs ethanol). # vs †, P =0.03 (3 hr ethanol vs 6 hr ethanol), # vs ¶, P =0.006 (3 hr ethanol vs 24 hr ethanol), † vs ¶, P =0.04 (6 hr ethanol vs 24 hr ethanol).

