
Figure 2.
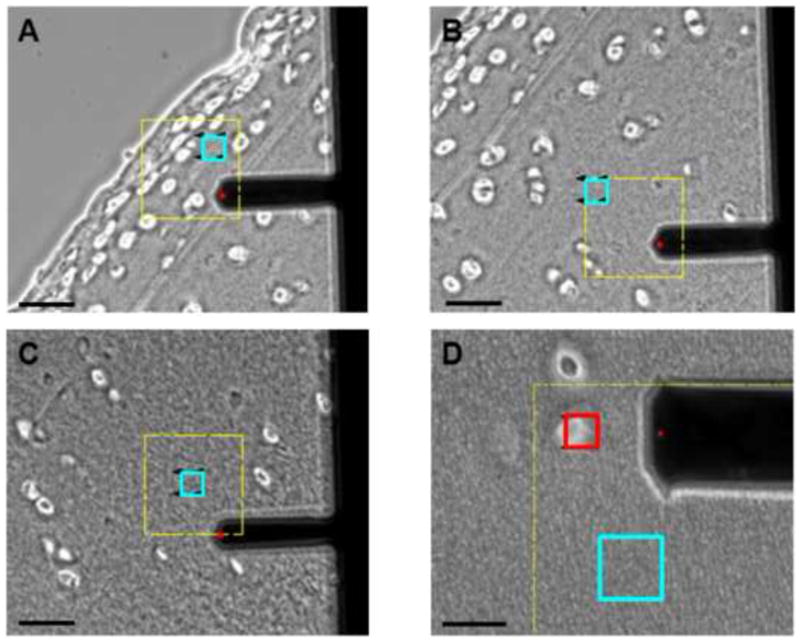
Phase contrast images showing ECM scan regions (blue) in the (A) superficial, (B) middle, and (C) deep zones based on microscopic examination of tissue sections. Cartilage section is oriented for loading parallel to the split-line orientation (1-dir). Scale bar = 50 μm. (D) PCM scan regions (red) were placed along the edge of cell-sized voids. An adjacent ECM scan region (blue) is also shown. Scale bar = 20 μm.