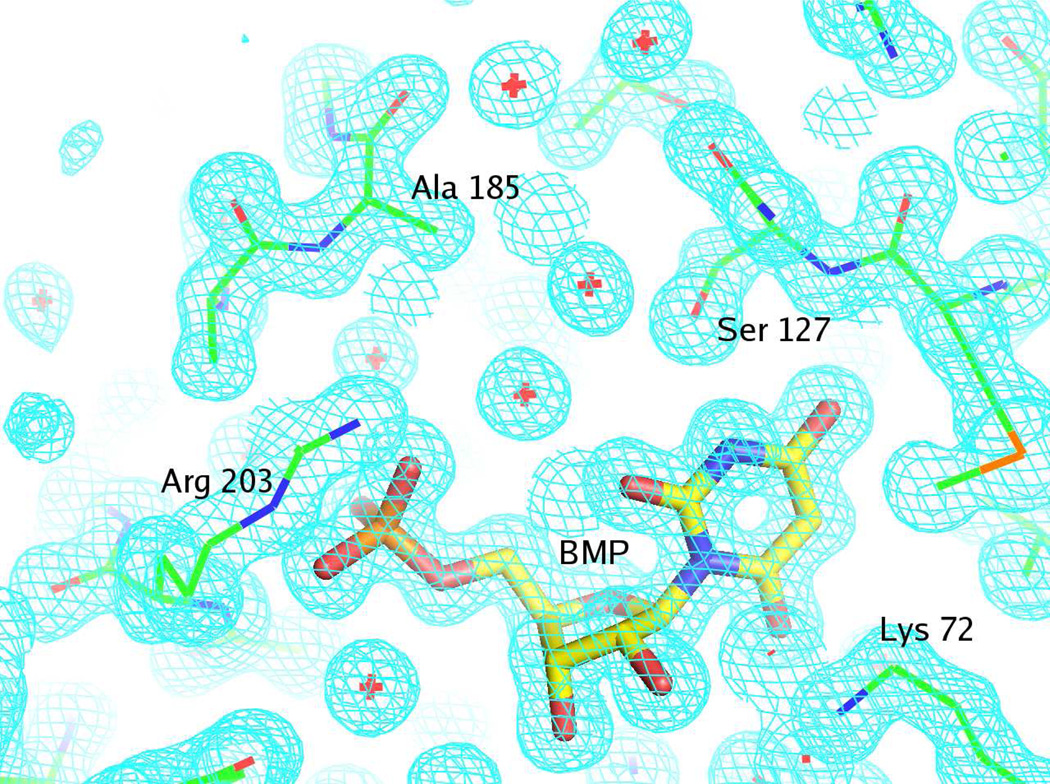
Figure 4.
Representative electron density map for the active site of the Q185A mutant complexed with BMP and contoured at 1.5 σ. The figure was produced with PyMOL (41). The details of the interactions between BMP and the active site are described in the text.

