Fig. 7.
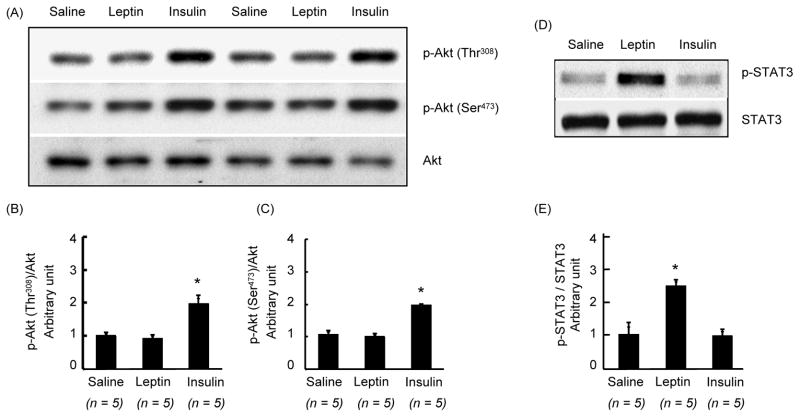
Changes in phosphorylation of Akt at Thr308 or Ser473 and that of STAT3 in the hypothalamus at 10 min after ICV injection of leptin (4 μg), insulin (10 mU) or saline. (A) Western blot of p-Akt (Thr308), p-Akt (Ser473), and Akt, p-STAT3 and STAT3. (B) Densitometric analysis of the immunoreactive bands for p-Akt (Thr308). (C) Densitometric analysis of the immunoreactive bands for p-Akt (Ser473). (D) Western blot of p-STAT3 and STAT3. (E) Densitometric analysis of the immunoreactive bands for p-STAT3. p-Akt and p-STAT3 levels were first normalized to Akt and STAT3 levels, respectively, and then expressed as relative to saline control group. Values are mean ± SEM for Values are mean ± SEM for the number of animals indicated in parentheses. *P < 0.05 versus all other groups.

