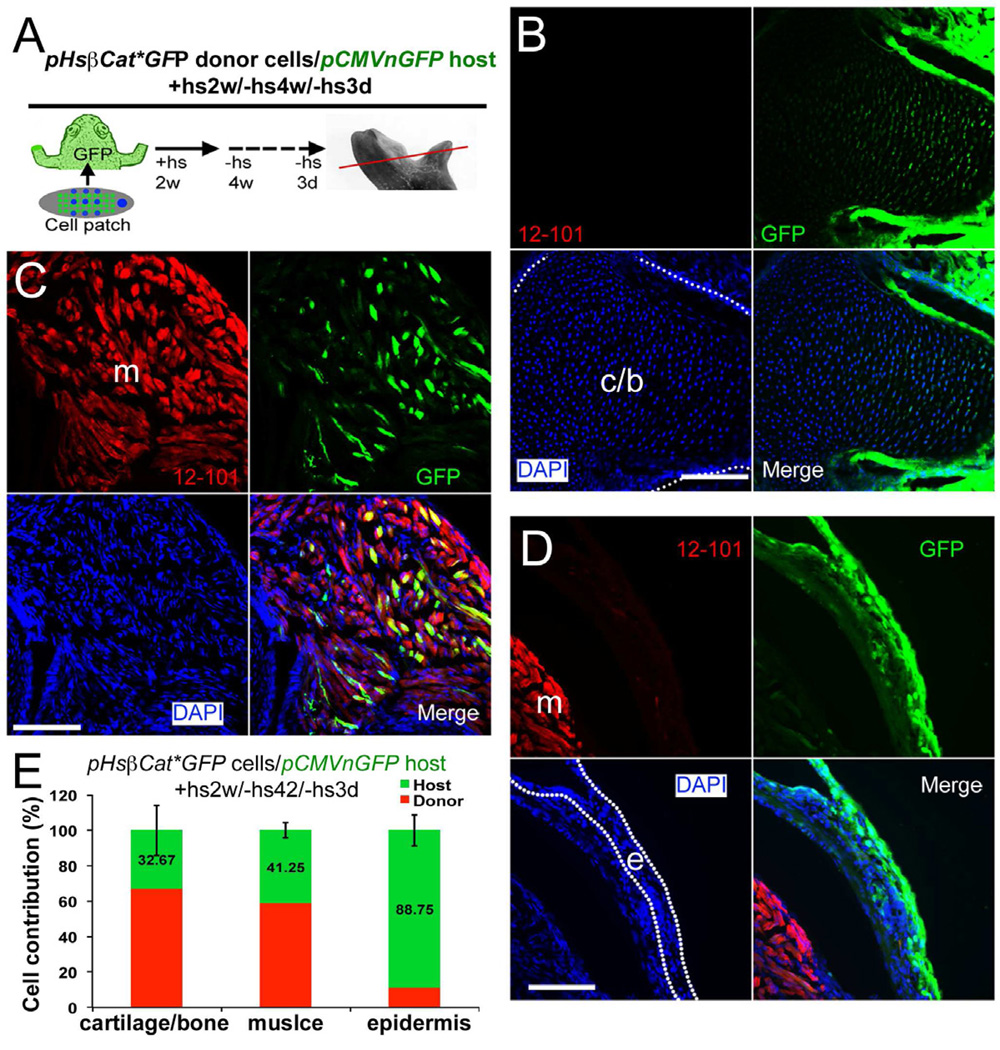
Fig. 7. Analysis of cell contribution in limb regenerates after (pHsβcat*GFP donor)/ (pCMVnGFP host) transplantations.
(A) Diagram of cell contribution analysis. pCMVnGFP host frogs were used, and GFP expression in pHsβcat*GFP donor cells was turned off by not giving heat shock treatments.Thus GFP+ cells shown in (B–D) are from the host. The red line indicates the level of sections shown in (B–D).
(B–D) Detection of host cells (green) in cartilage (B), muscle (C) and epidermis (D). Cartilage, muscle and epidermis are shown as above. Scale bars, 100 µm.
(E) Quantification of donor and host cell contributions in limb regenerates from (pHsβcat*GFP donor cells)/ (pCMVnGFP host) transplantations. Error bars, standard deviation; n=9 animals.
See also Fig. S2, S3.

