
Figure 1. 24-hour Urinary Sodium and Potassium Excretion.
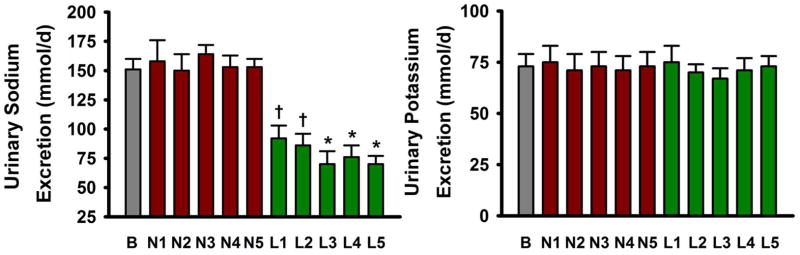
24-hour urinary excretion of sodium (left) and potassium (right) at baseline (B), weeks 1–5 of the normal sodium condition (N1–N5) and weeks 1–5 of the low sodium condition (L1–L5). Values are mean ± S.E.; * P<0.001; † P<0.005 vs. baseline or normal sodium of same week (repeated measures ANOVA with post-hoc Bonferonni corrected comparisons; n=17).