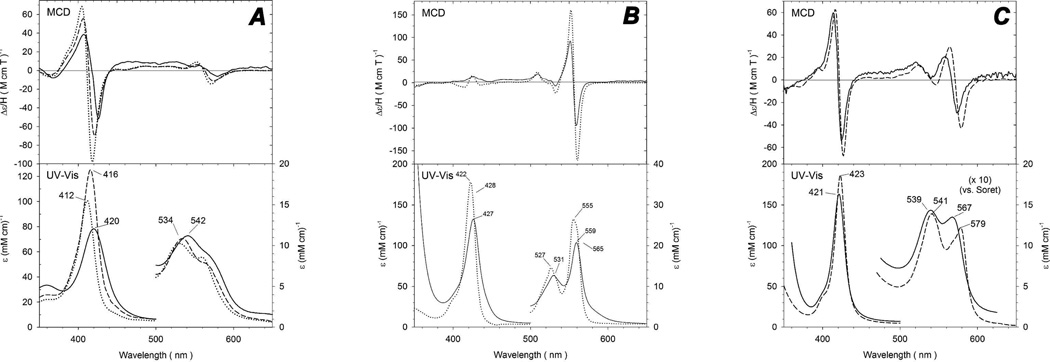
Figure 9.
MCD and UV-vis spectra of GAPDH-heme and model systems cytochrome b5 and sperm whale Mb. Panel A: spectra of ferric GAPDH-heme (solid line) at pH 7.8, cytochrome b5 (dotted line) and (Bis-Im) H93G Mb (dashed line). Spectra of ferric cytochrome b5 are replotted from reference (1) and spectra of ferric (Bis-Im) H93G Mb are replotted from reference (2). Panel B: Spectra of ferrous GAPDH-heme (solid line) and cytochrome b5 (dotted line). Spectra of ferric cytochrome b5 are replotted from reference (1). Panel C: Spectra of ferrous-CO complexes of GAPDH (solid line) and H93G-Im Mb (dashed line). Spectra of ferrous-CO of H93G-Im Mb are replotted from reference (3).

