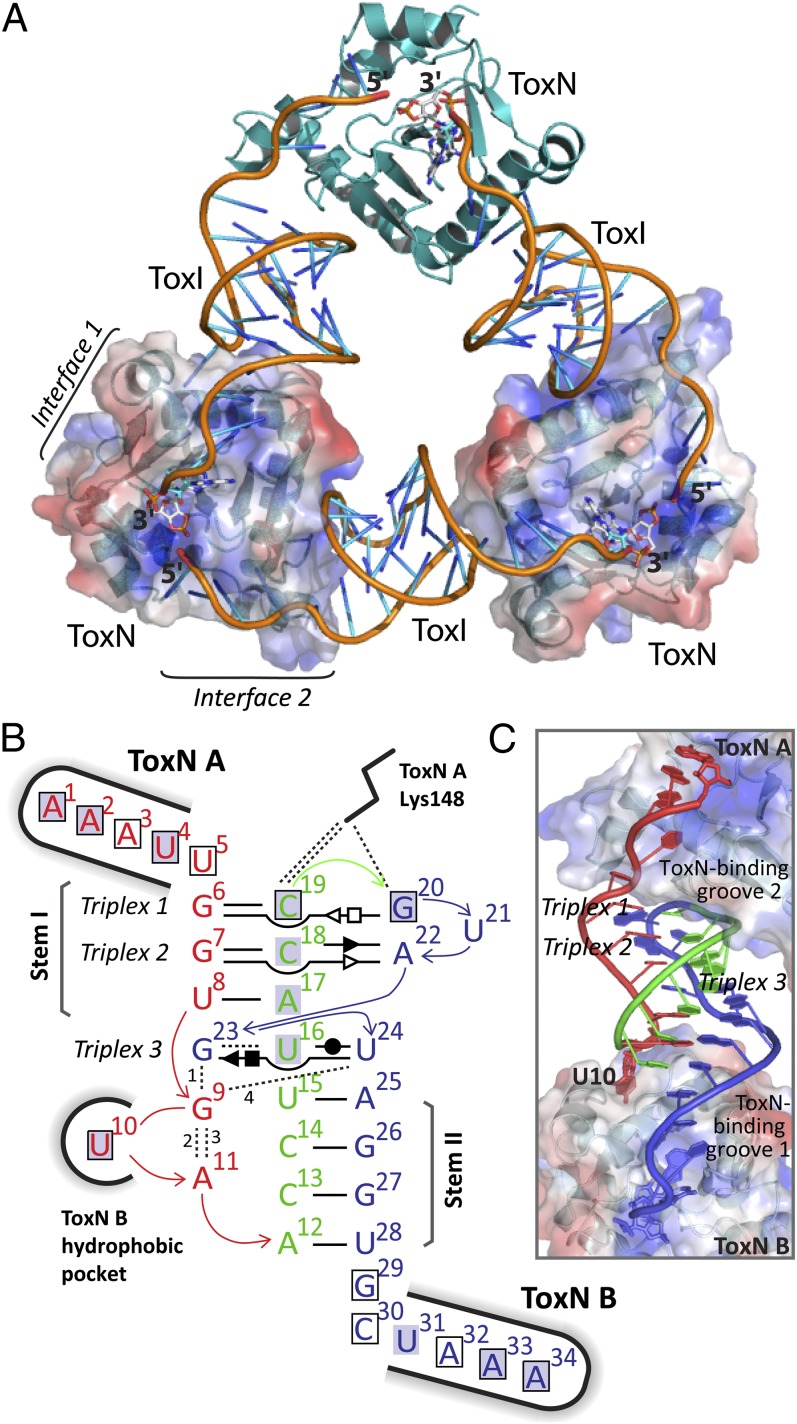
Fig. 5.
Structure of the ToxINBt complex. (A) The trimeric ToxINBt complex. ToxNBt is shown in cartoon representation in teal, and the ToxIBt RNA backbone is orange with the bases colored in a gradient from orange to blue. The surface of two ToxNBt monomers is shown also, with blue for positively charged and red for negatively charged regions. In each ToxIBt protomer the nucleotide A34 and its 2′,3′-cyclic phosphate are shown as white sticks. (B) Schematic of internal and external bonding of a single ToxIBt monomer. Canonical Watson–Crick A:T or G:C base pairs are represented by a single, black horizontal bar. Noncanonical base pairs of ToxIBt are shown in Leontis–Westhof symbols (49) with the interacting edges indicated as follows: Watson–Crick edge, ●; sugar edge, ►; Hoogsteen edge, ▪. Filled and open symbols indicate the cis or trans orientation of the glycosidic bonds, respectively. The vertically aligned letters indicate stacked bases. Black dashed lines indicate single hydrogen-bond interactions. Bonds numbered 1–4 involve backbone atoms as follows: 1, G9 (N3) to G23 (O2); 2, G9 (N7) to A11 (O2); 3, G9 (O2) to A11 (PO2); 4, G9 (N2) to U24 (PO2). The ToxNBt monomers at key interaction sites are indicated, and interactions between ToxIBt nucleotides and ToxNBt are indicated with a black outline to show base–ToxNBt interactions or a gray highlight to indicate backbone–ToxNBt interactions. See Fig. S4 for comparison with the ToxIPa structure. (C) A single ToxIBt pseudoknot, bound by two monomers of ToxNBt (labeled ‘”A” and “B”). ToxIBt is shown as a cartoon with nucleotides colored according to their location as in panel B. ToxNBt monomers are shown as a cartoon beneath a surface representation with positively and negatively charged regions colored in blue and red, respectively.

