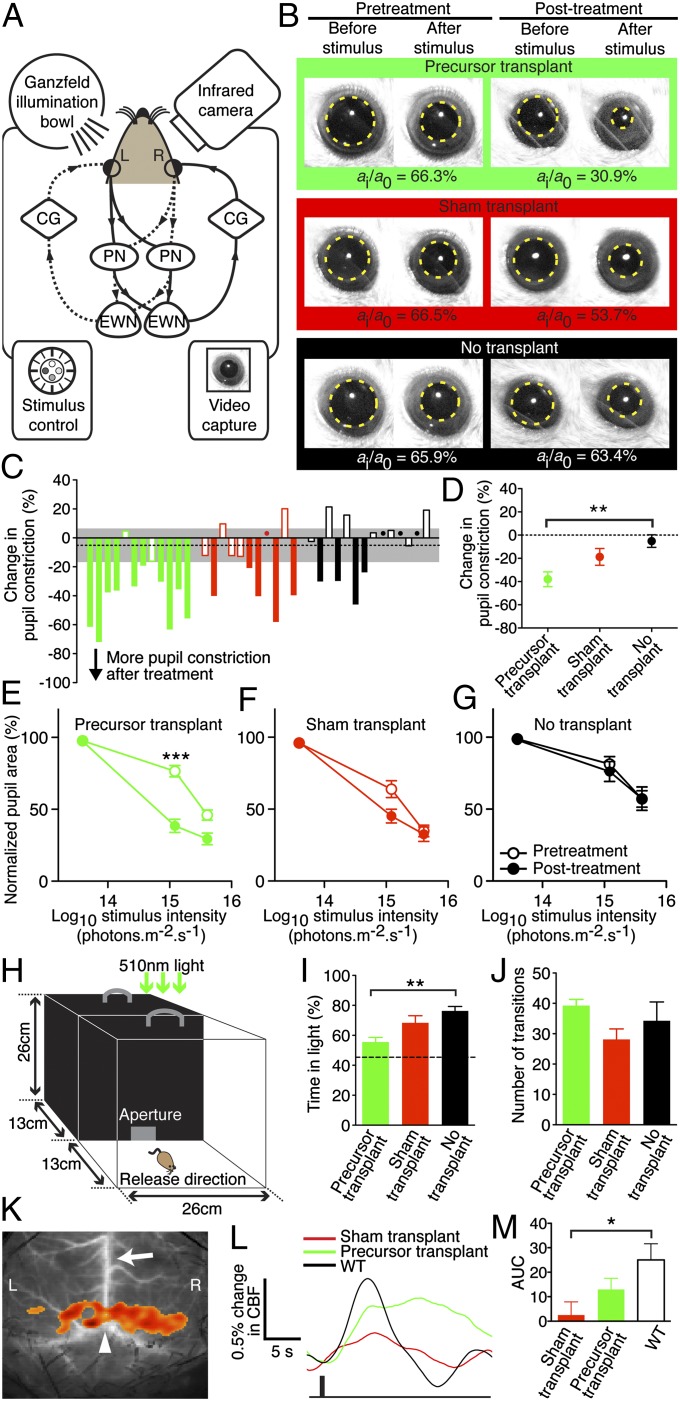
Fig. 4.
Rod precursor transplantation restores visual function to eyes with complete rod degeneration. (A) Retinal illumination results in signal transmission to both pretectal nuclei (PN) and Edinger–Westphal nuclei (EWN). Impulses are relayed via the ciliary ganglia (CG) and both pupils constrict. Solid and dashed lines show reflex arcs triggered by left (L) and right (R) eye stimulation, respectively. (B) Representative pupil images. (C) Overview of the change in pupil constriction from before to after treatment in all mice at 1.21 × 10¹⁵ photons⋅cm−2⋅s−1. Green, red, and black denote precursor, sham, and no transplant controls, respectively. Dots indicate values close to zero and dashed line indicates the mean change with 95% confidence interval (gray) of the non-transplanted controls. The PLR was measured in the same eye 3 d before and 2 wk after subretinal transplantation of 3 × 10⁵ cells. PLR was expressed as normalized pupil area as previously described (3). (D) Precursor transplantation improved pupil constriction, compared with no transplant controls (F2,34 = 7.264, P = 0.002, n = 11–14 each; **P = 0.001 post hoc). (E) Paired analysis before versus after treatment showed that at the median light stimulus intensity, the PLR improved significantly in precursor-treated animals (***t11 = 5.95, P < 0.0001, n = 12). (F and G) The PLR did not improve after sham transplantation (n = 11) or in untreated controls (n = 14) at any stimulus intensity. There were no significant differences between groups at baseline (P = 0.12). (H) Light-mediated behavior was measured under dim 510-nm illumination (150 nW⋅cm−2⋅s−1). (I) Precursor-transplanted mice spent less time in the lit compartment than rd1 controls (F2,20 = 7.608, P = 0.003, n = 7–8 each; **P = 0.003 post hoc). Dashed line indicates mean WT level. (J) Anxiety-related behavior (transitions between compartments) was similar across groups. (K) Cortical activation map in WT showing increased cortical blood flow (CBF) over L and R visual cortices; arrow, superior sagittal sinus; arrowhead, lambda. (L) Averaged L and R CBF time series from all mice after a 4-Hz (1-s) stimulus (black bar). (M) Precursor transplantation led to a higher CBF change than sham treatment compared with WT (F2,16 = 4.108, P = 0.04, n = 5–7 each; *P = 0.01). AUC, area under curve (0–7 s). Error bars, SEM.

