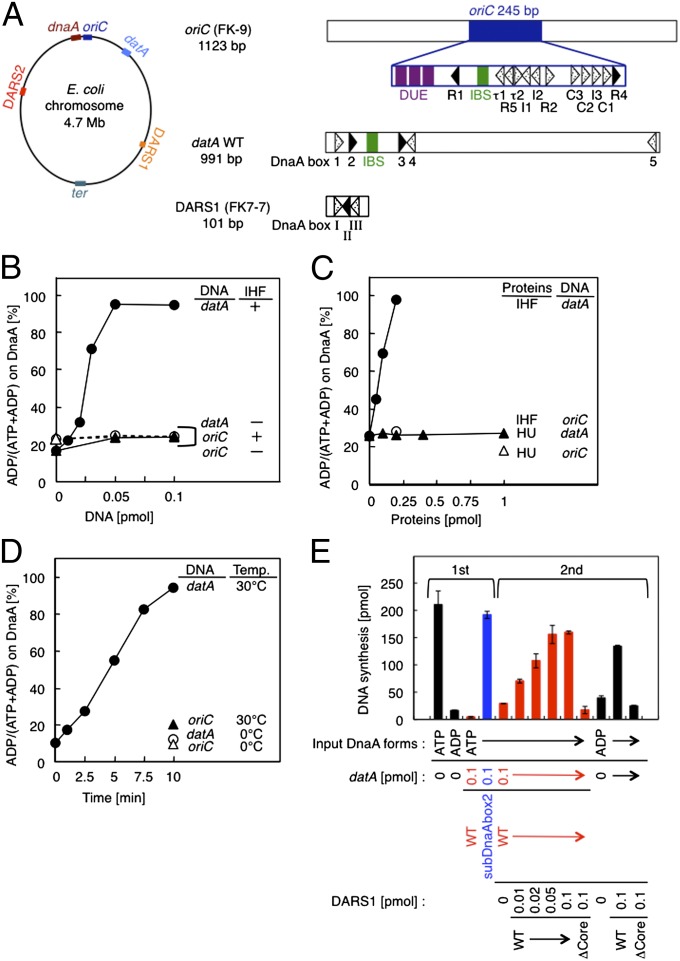
Fig. 1.
datA-dependent DnaA-ATP hydrolysis. (A) Schematic presentation of the chromosomal loci and structures of oriC, dnaA, datA, DARS1/2, and ter. (Left) The location of each site on the E. coli chromosome is indicated. (Right) Open bars indicate the oriC-, datA-, and DARS1-containing fragments used in this study: respectively, FK-9, datA WT, and FK7-7. Arrowheads represent DnaA binding sites that match the 9-mer consensus sequence completely (black) or contain a mismatch(es) (dotted). R5, I1–3, τ1–2, and C1–3 in oriC are low-affinity ATP-DnaA binding sites (1, 4, 9). DnaA boxes 1–5 in datA and DnaA boxes I–III in DARS1 are displayed similarly. IBS (green bars) and AT-rich repeats that facilitate duplex unwinding (AT repeats; purple bars) are also indicated. (B–D) In vitro reconstitution of datA-dependent DnaA-ATP hydrolysis. [α-32P]ATP-DnaA (1 pmol) was incubated under various conditions, and then analyzed by Thin-layer chromatography (TLC). The proportions of ADP-DnaA to total ATP/ADP-DnaA molecules are indicated as percentages (%). (B) ATP-DnaA was incubated at 30 °C for 10 min with the indicated amounts of datA WT (datA) (●, ○) or FK-9 (oriC) (▲, △) in the presence (●, ▲) or absence (○, △) of IHF (0.2 pmol). (C) ATP-DnaA was incubated with the indicated amounts of either IHF (●, ○) or HU (▲, △) in the presence (0.05 pmol) of datA WT (●, ▲) or FK-9 (○, △). (D) Reaction time course was analyzed at 0 °C (○, △) or 30 °C (●, ▲) in the presence of IHF (0.2 pmol) and either datA WT (0.05 pmol) (●, ○) or FK-9 (▲, △). (E) In vitro reconstitution of the DnaA cycle using datA and DARS1. DnaA activity was assessed using an in vitro replication system. In the first stage, IHF (0.4 pmol) and ATP-DnaA or ADP-DnaA (2 pmol) were incubated at 30 °C for 10 min in buffer (25 µL) containing (red bars) or excluding (black bars) datA WT, followed by the addition of DpnII and incubation at 30 °C for 5 min to digest datA DNA. In the second stage, the indicated amounts of DARS1 DNA (FK7-7, 1 µL) were added to samples (27 µL) that had contained ATP-DnaA and datA WT (red bars) or ADP-DnaA (black bars) in the first stage, followed by further incubation at 30 °C for 15 min. After the first- and second-stage reactions, portions (5 µL) were withdrawn, and DnaA initiator activity was analyzed in vitro using a minichromosome replication system in a crude protein extract. In the second stage, subDnaAbox2 (blue bar), a DnaA box 2-substituted derivative of datA that is inactive in DDAH, was used as a negative control (see also Fig. 2B). In the second stage, DARS1 mutant ΔCore (FK7-21), which contains a deletion of DnaA boxes I–III and is inactive in DnaA-nucleotide exchange, was used as a negative control. Error bars represent the SD from two independent experiments.

