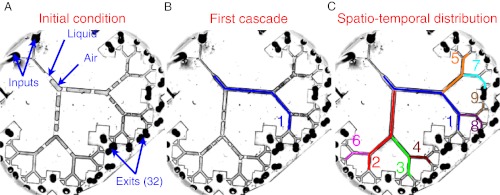
Fig. 4.

Initial distribution of plugs and spatial distribution of successive airway reopenings obtained by pushing an initial set of liquid plugs by  kPa in a six-generation network. A given path is “open” when all the plugs obstructing the airflow from the entrance to the exit have ruptured. (A) Initial plug distribution in the network. (B) The path taken by the first cascade. (C) Spatio temporal distribution of successive cascades. Paths are numbered according to the order in which they reopen.
