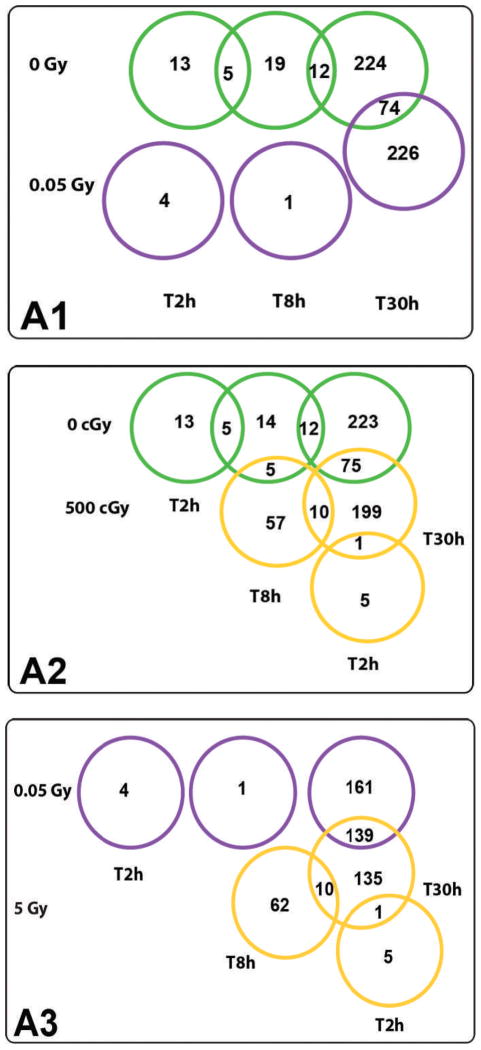
FIG. 2.
Venn diagrams illustrating gene overlap across postirradiation times and doses tested. Panel A1: Comparison between significantly differentially expressed (P ≤ 0.015) genes in response to 0 and 0.05 Gy. Panel A2: Comparison between significantly differentially expressed (P ≤ 0.015) genes in response to 0 and 5 Gy. Panel A3: Comparison between significantly differentially expressed (P ≤ 0.015) genes in response to 0.05 and 5 Gy.

