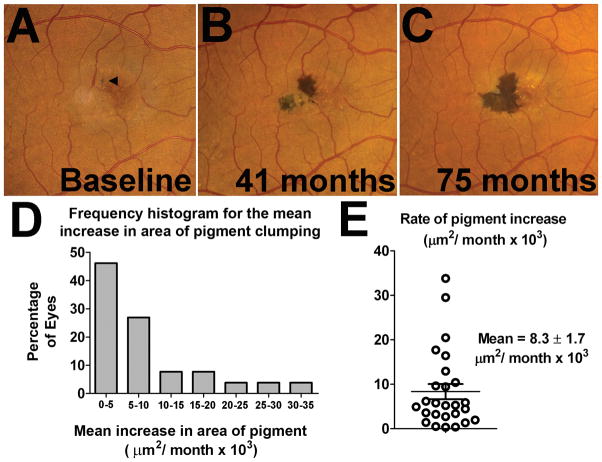
Figure 3. Natural history of pigment clumping changes in idiopathic macular telangiectasia type 2 (IMT2).
(A–C) An example of a study eye that demonstrated progressive increases in the total area of pigment clumping with time. The total area of pigment increased from 13 × 103 μm2 at baseline (A, arrowhead)) to 70 × 103 μm2 at 41 months (B), and to 127 × 103 μm2 at 75 months (C). Separate islands of pigment clumping were often observed to emerge in close proximity to one another and then coalesce as they enlarged with time. (D) Frequency histogram showing different rates of growth for study eyes. All study eyes for which longitudinal follow-up of pigment clumping was available (n = 22) demonstrated a monotonic increase in pigment area as a function of time. Most eyes demonstrated a linear rate of increase with time in the area of pigment clumping. (E) Graph showing the distribution of the average linear rate of expansion of pigment area, with a mean (±SEM) rate of growth of 8.3±1.7 × 103 μm2 per month.

