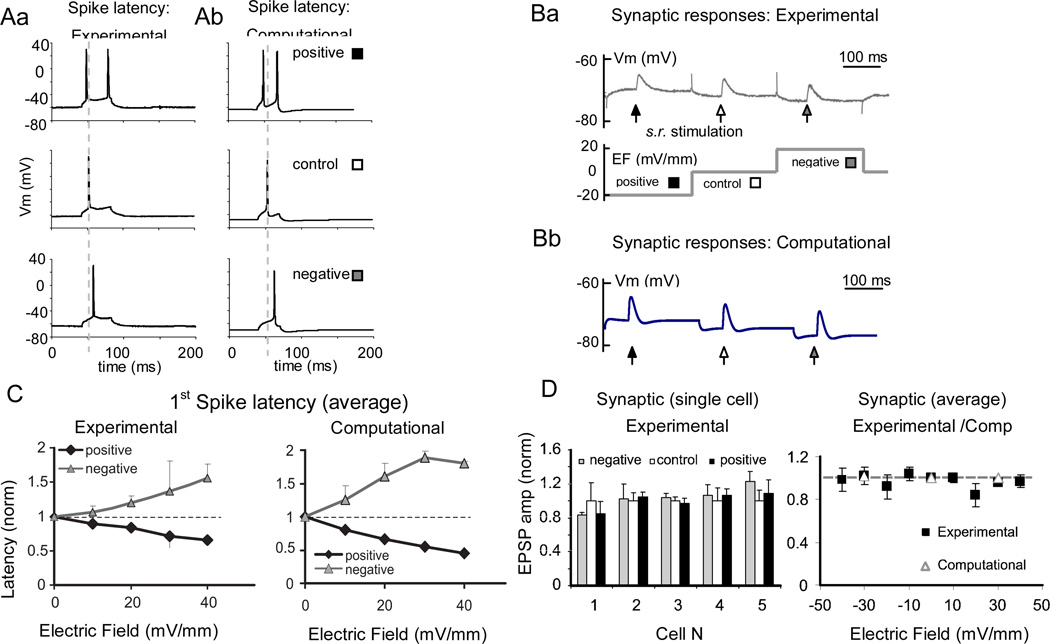
Figure 3.
Effect of electric field on spike latency and synaptic responses. A. The latency of the first spike evoked by a square depolarizing current pulse is oppositely affected by positive (black square) and negative (gray square) electric fields compared to control (white square): experiments (Aa) and model (Ab). B. Sample synaptic responses evoked by stratum radiatum stimulation at positive, neutral, and negative electric fields: experiments (Ba) and model (Bb). C. Spike latency effect scales with the strength of the electric field. First spike latencies for positive (black) and negative (gray line) fields are normalized to the control (0 mV/mm) and averaged across recorded cells. Error bars represent standard error of mean. Left: experimental (n=8); right: computational (n=9). Dashed horizontal line represents control level (y=1). D. Left: summary of the experimental synaptic effects of a ± 10mV/mm electric field, normalized to the 0 mV/mm control. Right: most cells show a non-significant synaptic effect that does not depend consistently on the sign of the field. The summary plot of these 5 experimental cells between −40 mV/mm and 40 mV/mm (solid line) of electric field and 9 computational cells (open triangles) at 30 mV/ mm of electric field shows that the synaptic effect remains negligible at the higher strengths of electric field in both experiments and simulations. Gray line (y=1) represents control level.

