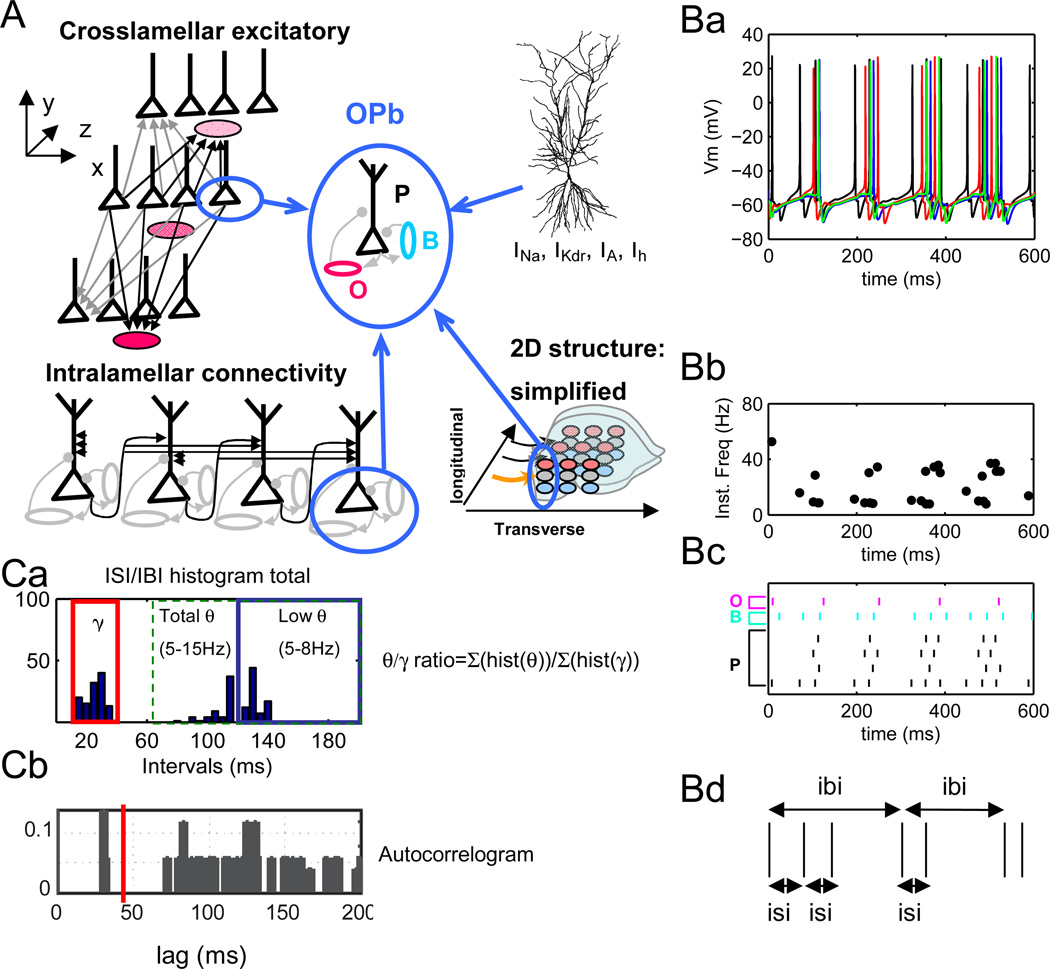
Figure 4.
A. Basic network configuration (OPb) consisting of realistic pyramidal cells (P) and reduced oriens (O) and basket cells (B) assembled in several lamellae (three out of five lamellae are shown for simplicity). Pyramidal cells have full morphology (cf. Figure 1). B cells provide perisomatic inhibitory feedback to pyramidal cells, and O cells provide direct dendritic modulation. O-B inhibition is not present. Unless noted otherwise, O-P connections correspond to inhibitory synapses on proximal dendrites. Arrows and dots indicate excitatory and inhibitory connections, respectively. Network is arranged in a 2-dimensional layout to simulate excitation propagation within (transverse, x axis) and between (longitudinal, z axis) lamellae. B. Simulation results (no electric field). Ba. Spike trains generated by 4 P cells in one lamella demonstrate theta-modulated gamma frequency firing. Bb. Instantaneous firing rate plot for 4 P cells in one lamella. Bc. Raster plots of 4 P (black, bottom four rows), 1 B (blue, 2nd row from the top) and 1 O (magenta, top row) cells. Bd. Schematics of interburst (IBI) and intra-burst interspike interval (ISI) calculation. Ca. Histogram of IBI and ISI distribution over all 5 lamellae from simulations in Ba-Bc. Both “low theta” (5–8 Hz) and “high theta” (9–15 Hz) are observed. Theta/gamma ratios are computed as the number of intervals in the 5–15 Hz (“total”) or 5–8 Hz (“low”) divided by the number of intervals in the 30–80 Hz range.
Cb. Autocorrelogram of data averaged across all pyramidal cells showing two frequency groups, one in gamma (~30 ms) and one in theta (~110 ms) range.

