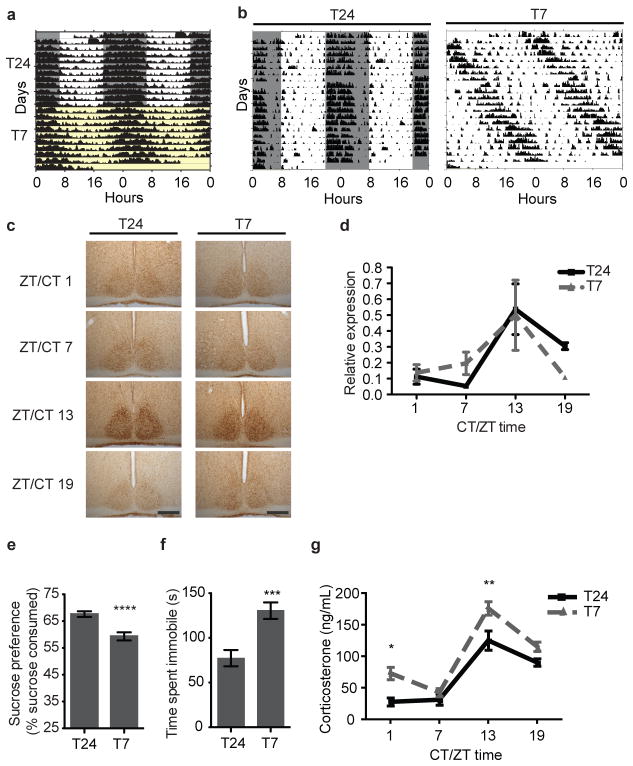
Figure 1. Aberrant light increases depression-like behavior and corticosterone levels.
A. Body temperature rhythms under the T24 (grey/white) and T7 (yellow) cycle. B. General activity rhythms under the T24 (left) and T7 cycle (right). C. SCN PER2 was rhythmic under the T24 and T7 cycles. Scale bars, 200μm. D. Liver Per2 was rhythmic (ptime=0.0072) (n=3–4 per time point, plight cycle=0.8482). E. T7 mice showed sucrose anhedonia (n=16,15, p<0.0001). F. T7 mice showed increased immobility in the FST (n=22 per group, p=0.0002). G. Corticosterone levels were rhythmic but elevated in T7 mice (n=5–6 per timepoint, ptime<0.0001, plight cycle<0.0001, Bonferroni post-test: p<0.05 ZT/CT 1 and p<0.01 ZT/CT13). ****p<0.0001, ***p<0.001, **p<0.01, *p< 0.05. Error bar indicates SEM.

