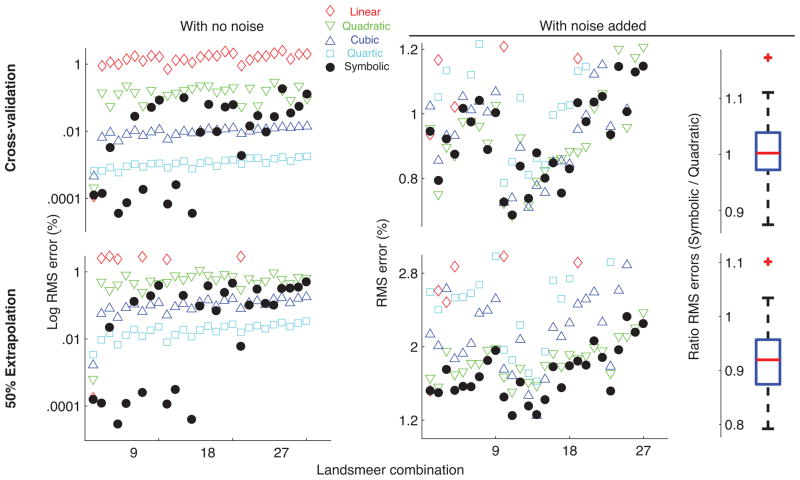
Fig. 6.
Comparison of root mean squared errors between symbolic and polynomial regressions for the 27 combinations of Landsmeers models with no noise and with ±5% noise added to joint angles and ±1% to tendon excursions. While cubic and quartic regressions have lower errors than symbolic regression for data with no noise, when experimentally realistic noise is added, symbolic regression has much lower errors than these polynomial regressions. The box plot on the right shows the ratio of RMS errors of symbolic to quadratic regression (best among polynomial regressions) for the data with noise. The median ratio is close to one for cross-validation testing demonstrating that symbolic and quadratic regressions are equivalent with respect to RMS errors in this case whereas for extrapolation testing, the median ratio is 0.92 indicating that on average, symbolic regression has 8% lower RMS errors than quadratic regression across the 27 models.

