
Fig. 1.
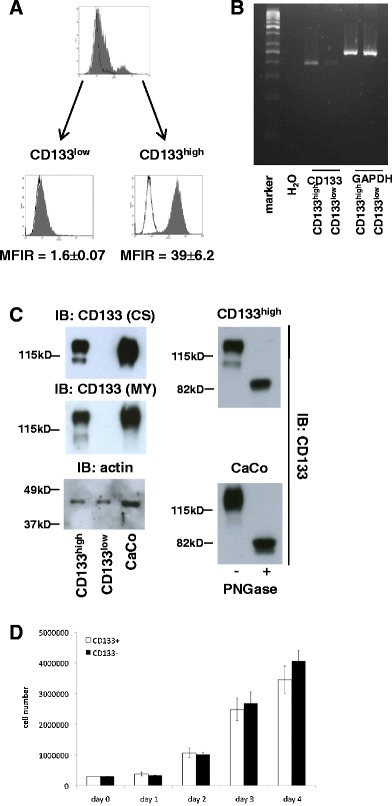
CD133 expression in HEK293 cells. a HEK293 cells were stably transfected with an expression plasmid for CD133. Flow cytometry analysis revealed mixed populations of CD113low and CD133high cells within single stable transfectants. Cells were sorted to obtain pure populations with mean fluorescence intensities ratios of CD133low = 1.6 ± 0.07 and CD133high = 39 ± 6.2. b CD133 mRNA RNA levels were assessed by standard RT-PCR in CD113low and CD133high cells. GAPDH mRNA levels served as control. c CD133 protein levels were assessed upon immunoblotting with two independent antibodies from two different clones for the same molecule (CS Cell System, MY Miltenyi). Colon carcinoma cells CaCo, which endogeneously express CD133, were assessed similarly as control. Actin was used as a loading control (left panels). Lysates from CD133high and CaCo cells were treated with PNGase to deglycosylate proteins. Thereafter, lysates of untreated cells and treated lysates were separated in a 10 % SDS-PAGE and CD133 detected with specific antibody (MY, right panels). d Equal cell numbers (3 × 10⁵ cells) of HEK293 CD113low and CD133high cells were plated, and the cell numbers were assessed at the indicated time points. Shown are the mean and standard deviations of the three independent experiments