
Fig. 2.
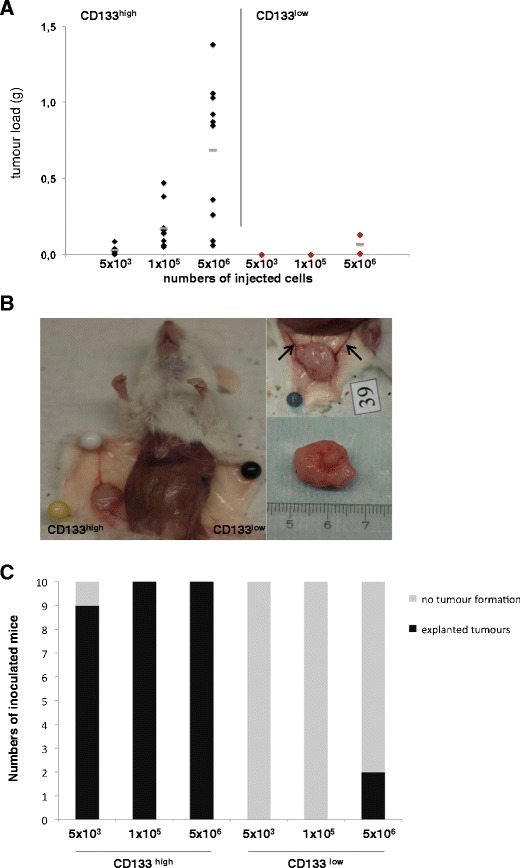
Measurement of the tumourigenic potential of CD113low and CD133high cells in vivo. a SCID mice were inoculated subcutaneously with increased amounts of CD113low and CD133high cells in the left and right flank, respectively. After 21 to 36 days, the animals were killed, and the tumour load in grams was monitored. The results shown represent two experiments with five mice each (n = 10). Black and red diamonds give the tumorload in regard of numbers of injected cells. b Tumours generated by CD113low and CD133high cells are exemplified before (left and upper right images) and after preparation (lower right image). The blood vessels supplying the tumours are marked with arrows in the upper right panel. c Tumour formation frequency of CD133low and CD133high HEK293 cells. SCID mice (n = 10 in two independent experiments) have been inoculated with the indicated cell numbers and tumour formation assessed over a time period of 21–36 days. Shown are frequencies of tumour formation: grey bars represent no formation of tumours, while black bars represent tumour formation independently of the tumour size and weight