
Fig. 6.
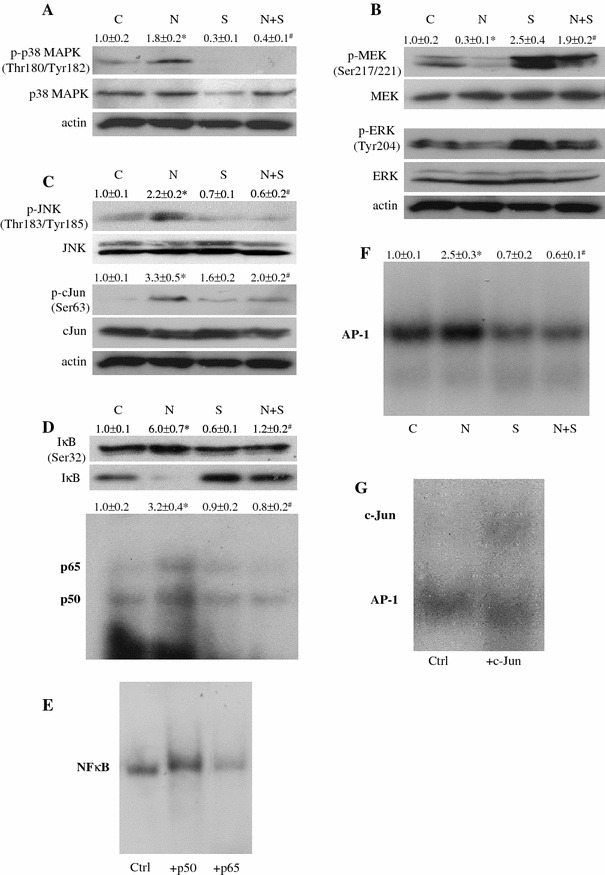
The effects of SAMC on signaling molecules and transcription factors, which mediate NAFLD-induced insulin resistance and liver injury. Representative results of the phosphorylation status and total expression of a p38 MAPK, b MEK1/2–ERK1/2 and c JNK–c-Jun pathways were measured by Western blot. Activities of d NF-κB and f AP-1 were measured in rat liver nucleic protein by 32P-labeled gel-shift assay. Specificity of NF-κB (e) and AP-1 (g) were tested by incubating p50/p65 and c-Jun antibodies with nucleic protein, respectively. Numerical values represent the mean ratio and SEM of the optical density of phosphorylated form divided by total form of protein, or the optical density of radioactive bands (n = 7). Control group is set as 1.0. C control, N NAFLD, S SAMC, N+S NAFLD+SAMC. Asterisk represents p < 0.05 versus control group, while Hash represents p < 0.05 versus NAFLD group